
Fact-checked by the MyFinancial101 editorial team
Quick Answer
Dollar-cost averaging in a volatile market means investing a fixed dollar amount on a set schedule regardless of price swings, so you automatically buy more shares when prices drop. The strategy works best when you automate contributions, resist pausing during downturns, and apply tactical tweaks like scaling up on deep dips. Most investors can set this up in under 30 minutes and see measurable cost-basis advantages within 6 to 12 months of choppy conditions.
The counterintuitive truth about dollar-cost averaging in a volatile market is that volatility is not the obstacle, it is the engine. Every sharp dip in price means your fixed contribution buys more shares than it would have the week before. That mechanical advantage is what turns a scary market into a quiet compounding machine. According to the Financial Industry Regulatory Authority (FINRA), DCA involves investing equal portions at regular intervals regardless of conditions, which removes emotion from decision-making and helps limit losses during declines.
Market swings in 2025 and early 2026, driven by tariff uncertainty, rate policy shifts, and sector rotations, have pushed many retail investors to the sidelines. That is exactly the wrong response. The investors who automate and stay the course during high-volatility stretches tend to accumulate a lower average cost per share than those who try to time entries. If you have been sitting in cash waiting for the “right moment,” this guide is for you.
What follows is a step-by-step breakdown for anyone who wants to move beyond basic “invest regularly” advice and apply the techniques that experienced investors actually use when markets get choppy. If you are just getting started, you may also want to read our guide on how to start investing with zero experience before jumping in.
Key Takeaways
- Lump-sum investing outperforms DCA about two-thirds of the time historically, but DCA cuts maximum drawdown exposure and narrows that gap significantly in volatile or declining markets, according to Northwestern Mutual’s 2025 analysis.
- In the 2008 crash, a $100,000 lump-sum investment ended the year at roughly $61,500, while a dollar-cost averaging approach reduced losses to approximately 26%, a difference of about $12,700, per Forbes citing Robert Shiller data.
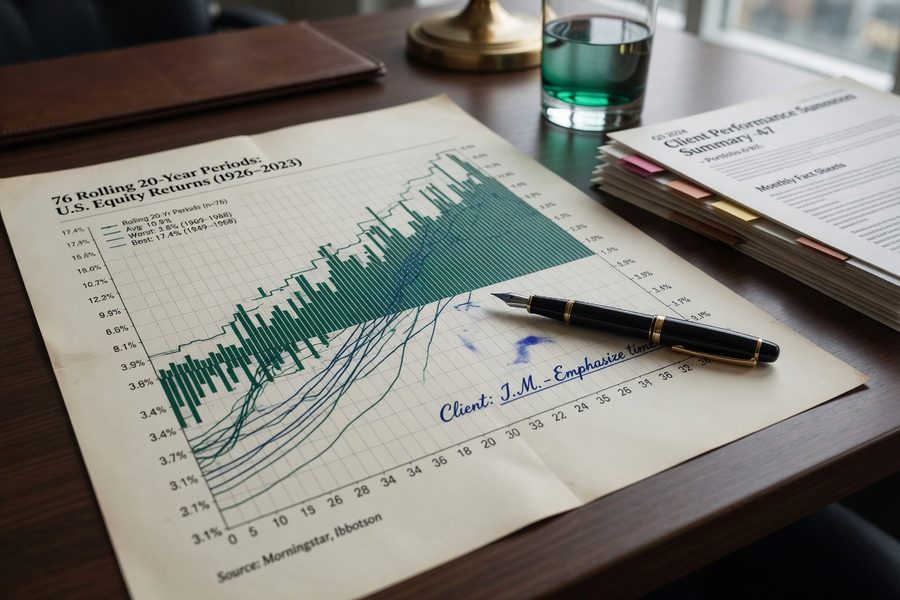
- Over 66 of 76 rolling 20-year periods since 1926, lump-sum investing outperformed DCA, but the average margin was modest and DCA delivered more consistent behavioral adherence, per the Schwab Center for Financial Research.
- Academic research shows DCA produces a higher Sharpe ratio (0.68 vs. 0.60) than lump-sum investing in environments with roughly 18% volatility, meaning better risk-adjusted returns when markets are choppy.
- The U.S. Securities and Exchange Commission (SEC) identifies DCA as one of the most reliable ways for long-term investors to protect against the risk of committing all capital at the worst possible moment.
- Tactical tweaks, such as scaling contribution size on dips or pairing DCA with tax-loss harvesting, can amplify returns beyond what a rigid fixed-amount schedule alone produces, especially in sustained high-volatility periods.
In This Guide
- Step 1: What Dollar-Cost Averaging Actually Is and Why Volatility Makes It Matter More
- Step 2: How Volatility Changes the Math Behind DCA
- Step 3: The Pro Technique Most Beginners Skip, Tactical Tweaks to Standard DCA
- Step 4: DCA vs. Lump Sum in Volatile Markets, What the Data Actually Shows
- Step 5: Real Risks and Limitations That Can Undermine DCA
- Step 6: How to Set Up and Stick With DCA in Practice
- Step 7: When DCA Is Not the Best Move and What to Consider Instead
- Frequently Asked Questions
Step 1: What Dollar-Cost Averaging Actually Is and Why Volatility Makes It Matter More
Most beginners think of dollar-cost averaging as simply “investing on a schedule.” That framing misses the point. DCA is a deliberate risk-management tool: you invest a fixed dollar amount at regular intervals, weekly, biweekly, or monthly, regardless of whether the market is up, down, or sideways. The mechanics matter. Because the dollar amount is fixed, a lower share price means you buy more shares that period. A higher price means you buy fewer. Over time, this automatic adjustment produces an average cost per share that is lower than the average price over the same period.
How It Works in Practice
Say you invest $500 every month into an S&P 500 index fund. In January, shares cost $50 each, you buy 10. In February, a sell-off drops the price to $40, you buy 12.5 shares. In March, prices recover to $45, you buy roughly 11.1 shares. Your average cost across those three months is about $44.44 per share, even though the average share price over that same period was $45. That gap is the mathematical core of DCA, and it widens the more volatile the market gets.
Why Beginners Often Misunderstand It
The common mistake is treating DCA as a passive habit rather than an active strategy. It only works as designed when you hold the schedule firm during dips, which is precisely when most investors panic and pause. The SEC recommends DCA specifically because it protects investors from the very human tendency to commit all capital at the worst possible moment. Volatility is not a threat to DCA. Stopping contributions during volatility is.
Dollar-cost averaging is already built into most workplace retirement plans. Every paycheck contribution to a 401(k) is a form of DCA, you are investing a fixed portion of your income on a fixed schedule, regardless of market conditions.
Step 2: How Volatility Changes the Math Behind DCA
Higher volatility directly amplifies DCA’s cost-reduction effect. A smooth, steadily rising market gives DCA almost no room to work, your cost basis tracks close to the average price. Choppy or declining markets are where the strategy earns its keep.
The Share-Accumulation Advantage
Consider what happens in a sustained high-volatility stretch. When a price swings from $100 to $60 and back to $80, your fixed $1,000 monthly contribution buys 10 shares, then 16.67 shares, then 12.5 shares. Your average cost is roughly $77.28 per share, well below the $80 recovery price. A lump-sum investor who deployed at $100 is still underwater. Your DCA position is already profitable.
This is the behavioral edge that experienced investors prize. Academic analysis published in 2022 by Zein and Darma found that in environments with roughly 18% annualized volatility, DCA produced a Sharpe ratio of 0.68 versus 0.60 for lump-sum investing. That is a measurably better risk-adjusted return, not because DCA generates higher raw returns, but because it dramatically reduces the damage from poor entry timing.
Staying Disciplined When Fear Peaks
The behavioral advantage is real, but it only materializes if you stay the course. Behavioral finance research consistently shows that retail investors underperform their own funds because they pause or exit during drawdowns and miss the recovery. DCA, when automated, short-circuits that pattern. The schedule enforces buying during the exact moments when human psychology resists it most.
In the 2008 financial crisis, a $100,000 lump-sum investment ended the year at approximately $61,500. An equivalent dollar-cost averaging approach reduced the loss to roughly 26%, a difference of about $12,700, according to Forbes citing Robert Shiller data.

Step 3: The Pro Technique Most Beginners Skip, Tactical Tweaks to Standard DCA
Rigid fixed-amount DCA is the baseline. The technique most beginners overlook is rule-based adjustment: scaling your contribution size when prices drop sharply, without abandoning the schedule. This is sometimes called value averaging or SmartDCA, and it supercharges the share-accumulation math.
Value Averaging and VIX-Based Scaling
One approach ties contribution size to market stress indicators. When the CBOE Volatility Index (VIX) spikes above a set threshold, say, 25 or 30, you increase your contribution by a predetermined amount, perhaps an extra 25% to 50% above your baseline. When the VIX is low and markets are calm, you stick to your standard amount. This is not market timing; you are still investing on a fixed schedule. You are just deploying more capital when the price discount is deepest.
A simpler version: set a rule that any time your target asset drops more than 10% from its 52-week high, you double your standard contribution for that period. When it recovers to within 5% of the high, you revert to the base amount. The rule is mechanical. It removes the emotional decision-making and replaces it with a pre-committed response.
Pairing DCA with Tax-Loss Harvesting
Volatile markets create tax-loss harvesting opportunities that most DCA investors ignore. When a fund or ETF in your taxable account drops significantly, you can sell it, book the capital loss for tax purposes, and immediately buy a similar (but not identical) fund to maintain your market exposure. That harvested loss offsets gains elsewhere in your portfolio. Combined with your DCA schedule, this technique turns market volatility into a direct tax benefit. Platforms like Betterment and Wealthfront automate this process, but you can execute it manually in any taxable brokerage account.
When adding DCA to a taxable account, prioritize broad index ETFs with low expense ratios over individual stocks or actively managed funds. Lower turnover means fewer taxable events, and the wider diversification reduces the risk that a single holding blows up your cost-basis math.
Step 4: DCA vs. Lump Sum in Volatile Markets, What the Data Actually Shows
Here is the honest version: lump-sum investing wins most of the time. Over the 66 of 76 rolling 20-year periods since 1926, lump-sum investing outperformed DCA, according to the Schwab Center for Financial Research. Over any given 36-month period, lump-sum outperforms 92% of the time for a standard 60/40 portfolio, according to Vanguard data cited by Forbes. Over rolling 10-year periods, Northwestern Mutual found lump-sum wins 75% of the time.
But those figures assume the investor has a lump sum to deploy. Most people do not. And the gap between outcomes, when both are expressed in dollar terms, is instructive. Over the 20-year period from 2001 to 2020, the Schwab Center for Financial Research found a lump-sum annual investor ended with $135,471 versus $134,856 for an equivalent DCA investor, a difference of just $615 over two decades. That is a narrow margin. The real cost of DCA is small; the behavioral benefit of staying invested is large.
Where DCA genuinely outperforms is in post-crash recoveries and sustained high-volatility environments. The 2000-2009 decade, featuring two major bear markets, is the clearest historical example. Investors who dollar-cost averaged into broad index funds during that period accumulated shares at substantially lower prices than any single lump-sum entry could have achieved, and they recovered far faster when the bull market resumed in 2009.
The lump-sum vs. DCA debate is only relevant if you actually have a large cash position to deploy all at once. For most investors adding from regular income, DCA is the only practical option, and framing it as a “compromise” misses the point entirely.
Step 5: Real Risks and Limitations That Can Undermine DCA
DCA is not foolproof. Several specific risks can quietly erode its advantages, and knowing them in advance is the difference between using the strategy well and being surprised by poor results.
Cash Drag in Bull Markets
The biggest structural weakness of DCA is opportunity cost during sustained uptrends. If you are sitting on $50,000 in cash and deploying it in $5,000 monthly installments while the market rises 20% in 6 months, your later contributions buy in at higher prices. That is cash drag, and it is why lump-sum investing wins most historical backtests. The drag is real, but it is the cost of managing sequence-of-returns risk, a trade-off worth making when volatility is high and your entry timing is genuinely uncertain.
Execution Failure: Stopping During Downturns
The most common way investors sabotage their own DCA strategy is by pausing contributions during prolonged downturns. This is the exact opposite of what the strategy requires. When markets fell sharply in 2022, behavioral data showed a meaningful share of self-directed retail investors reduced or halted automatic contributions. Those investors locked in the strategy’s only real costs, buying at higher prices before the dip, while missing the lower-price accumulation phase where DCA’s advantage is greatest. Automation removes this temptation entirely.
Fees, Taxes, and Account Types
Frequent small purchases in taxable accounts can generate transaction costs or tax complexity if you are buying individual stocks or funds with front-end loads. In a taxable brokerage, each purchase creates a separate tax lot, which matters when you eventually sell. For most investors, tax-advantaged accounts, a 401(k), Traditional IRA, or Roth IRA, are the right primary vehicle for DCA. Fees in commission-free ETFs at major brokerages are effectively zero, but if you are using a managed account with an advisory fee, those charges accumulate. The case for prioritizing retirement accounts over other savings vehicles applies here as well.
Step 6: How to Set Up and Stick With DCA in Practice
Setting up a DCA plan correctly takes about 20 to 30 minutes and then largely runs itself. The goal is to remove as many decisions as possible from the ongoing execution.
How to Do This
First, choose your account type. For long-term retirement goals, a 401(k) or IRA is the right starting point, contributions are automatic through payroll deduction or scheduled bank transfers, and growth is tax-advantaged. For goals within 5 to 10 years, a taxable brokerage account at Fidelity, Schwab, or Vanguard works well, especially given that all three now offer commission-free ETF trading.
Second, select your investment vehicle. Broad market index ETFs, such as Vanguard’s VTI, iShares’ IVV, or Fidelity’s FZROX, are the cleanest DCA instruments. Low expense ratios, high liquidity, and wide diversification mean the strategy works without requiring individual stock selection. Set the contribution amount, connect your bank account, and choose a date that aligns with your pay cycle.
Third, build a simple review rule. Check your portfolio quarterly, not weekly, not after every headline. Ask one question: Is my contribution amount still appropriate given my income and goals? If yes, do nothing. If your income has grown, scale up. This is the entire active management requirement of a well-designed DCA plan. If you find market volatility pulling your attention toward higher-risk alternatives like cryptocurrency, use the quarterly review as a forcing function to stay aligned with your original plan.
What to Watch Out For
Reviewing too frequently is the primary execution mistake. Investors who check their accounts daily during volatile periods are far more likely to make emotionally driven changes. Automation is the structural solution, but discipline about review frequency is what keeps it intact.
“Volatility is a normal and even integral part of investing. Dollar-cost averaging could help you filter the noise and view periods of weakness as buying opportunities.”

Step 7: When DCA Is Not the Best Move and What to Consider Instead
DCA is not always the right answer. Three specific situations warrant a different approach.
Large Lump Sums After Windfall Events
If you receive a large cash position, from a home sale, inheritance, or bonus, deploying it all at once is statistically likely to outperform spreading it over 12 to 24 months. A hybrid approach threads the needle: invest 50% to 60% immediately and DCA the remainder over 6 to 12 months. This captures most of the lump-sum upside while preserving some behavioral insurance against a near-term crash. The $615 gap in 20-year outcomes between lump-sum and DCA in the Schwab data suggests the cost of caution is genuinely small.
Strong Upward Trends or Low Volatility
DCA’s cost-reduction advantage shrinks to near zero in steadily rising, low-volatility markets. When the VIX is consistently below 15 and a broad market index has been making new highs for months, cash drag from a gradual deployment strategy is a real cost with little offsetting benefit. In those conditions, faster deployment gets more of your capital working sooner.
When Consistency Remains a Problem
Some investors find that even automation is not enough, they manually override their DCA contributions during stress periods. If that describes you, target-date funds or professionally managed accounts remove the contribution decision entirely. The return difference between a well-managed target-date fund and a self-directed DCA plan is often smaller than the behavioral gap created by repeatedly pausing contributions. Consistency beats optimization. And if carrying high-interest credit card debt is pulling at your investment budget, pay that down first, guaranteed double-digit returns beat most market scenarios.
If you are deciding between a hybrid lump-sum/DCA approach, a simple rule: invest the full amount immediately if you have a 10+ year horizon and a high risk tolerance. Split 50/50 over 6 to 12 months if your horizon is shorter or volatility is causing genuine sleep-loss anxiety. The long-term math favors immediacy; behavioral sustainability favors the split.
| Approach | Best Scenario | Average Long-Term Outcome | Main Risk |
|---|---|---|---|
| Standard DCA (fixed monthly) | Investing from regular income; volatile or declining markets | $134,856 over 20 years per Schwab data | Cash drag in bull markets; stopping during downturns |
| Lump-Sum Investing | Large cash windfall; long horizon; rising market | $135,471 over 20 years per Schwab data | Full exposure at worst possible entry point |
| Hybrid (50% lump + 50% DCA over 6-12 months) | Windfall received during high-volatility period | Approximately midpoint between the two above | Slightly higher complexity; still requires behavioral discipline |
| Tactical / SmartDCA (VIX-scaled) | Experienced investor; high-volatility environment; clear rules set in advance | Potentially higher share accumulation than standard DCA; no formal long-run index | Requires pre-commitment to rules; risk of over-trading on signals |
| Target-Date Fund (automatic) | Investor who struggles with behavioral consistency | Roughly market-rate returns minus fund fees (typically 0.10%-0.15% for index-based) | Less control; may not optimize for individual tax situation |
Frequently Asked Questions
Should I keep dollar-cost averaging when the market is crashing?
Yes, and ideally you should increase your contribution if you have the cash flow to do so. A market crash is when DCA’s share-accumulation advantage is at its peak. Investors who paused contributions during the 2022 bear market or the 2008 crash missed the lowest-cost buying periods in recent history. The FINRA guidance on DCA specifically notes that the strategy limits losses during declines by ensuring you continue buying at lower prices rather than sitting in cash.
How much money do I need to start dollar-cost averaging?
You can start with as little as $1 per week on platforms like Fidelity, Schwab, or Robinhood, all of which support fractional share purchases. There is no minimum that makes DCA “work”, the mechanics function the same way at $50 per month as they do at $5,000. What matters more than the initial amount is the consistency and the length of time you stay invested.
Is dollar-cost averaging better than trying to time the market in a volatile market?
For virtually all retail investors, DCA is better than market timing. The evidence is direct: Northwestern Mutual’s research shows lump-sum outperforms DCA about 75% of the time over rolling 10-year periods, but that is not market timing. Timing requires predicting both when to exit and when to re-enter correctly. Academic literature consistently shows retail investors fail at both, and the compounded cost of missed recovery days destroys long-term returns far more reliably than cash drag does.
What’s the difference between dollar-cost averaging and value averaging?
Dollar-cost averaging invests a fixed dollar amount on a fixed schedule regardless of price. Value averaging targets a fixed portfolio growth amount each period, which means you invest more when markets are down and less (or even sell) when markets run up significantly. Value averaging is more mathematically precise but harder to execute, requires more active management, and can produce tax complications. For most investors, the behavioral simplicity of standard DCA outweighs the theoretical edge of value averaging.
Which account type is best for setting up a DCA strategy?
Tax-advantaged accounts, a 401(k), Traditional IRA, or Roth IRA, are the right primary vehicle for most long-term DCA strategies. Contributions grow without annual tax drag, and the automated nature of payroll contributions or scheduled IRA transfers enforces the DCA schedule without active management. Taxable brokerage accounts work well for goals outside retirement, but each purchase creates a separate tax lot, which complicates eventual selling. If you are deciding between retirement savings and other financial goals, reviewing the case for prioritizing retirement over college savings may be useful context.
How often should I invest with DCA, weekly, biweekly, or monthly?
Monthly contributions aligned with your pay cycle are the most practical frequency for most investors, and the performance difference between weekly and monthly DCA is negligible over long periods. What matters is consistency, not granularity. Biweekly works well for investors paid on a biweekly salary schedule since contributions can be automated directly from each paycheck. Weekly DCA requires more manual attention or a more sophisticated automation setup without adding meaningful return benefit.
Can DCA work for individual stocks or only index funds?
DCA works for both, but the risk profile is very different. With individual high-volatility stocks, the share-accumulation math can produce dramatic cost-basis advantages during corrections, the same mechanism works faster when the price swings are larger. The downside is that individual stocks can decline permanently (a company fails, gets delisted, or is disrupted), while broad index funds recover as long as the economy does. For most investors, index ETFs are the appropriate DCA vehicle. If you want to allocate a small portion of your portfolio to individual stocks via DCA, treat it as a separate, higher-risk bucket with a smaller allocation.
Does dollar-cost averaging reduce risk, or does it just spread it out?
It does both, and the distinction matters. DCA reduces timing risk, the specific danger of investing a large sum right before a major decline. It spreads sequence-of-returns risk across multiple entry points. But it does not reduce market risk broadly; your final portfolio is fully exposed to market conditions once fully invested. Over a 20-year horizon, the Schwab Center data showing a $615 gap between lump-sum and DCA outcomes confirms that the strategy’s primary value is behavioral and timing-risk reduction, not return enhancement in normal markets.
What should I do if I have both a lump sum and regular income to invest?
Deploy the lump sum using a hybrid approach: invest 50% to 60% immediately and spread the remainder across 6 to 12 months of fixed contributions. Continue your regular income-based DCA contributions on their existing schedule, separate from the lump-sum deployment. This structure captures most of the lump-sum statistical advantage while preserving meaningful downside protection if the market drops shortly after your initial investment. If high-interest debt is part of your picture, prioritize paying it down before deploying either strategy, eliminating a 20% APR credit card balance is a guaranteed return that no investment strategy can reliably match. Our guide to prioritizing and negotiating credit card debt covers how to approach that step first.
Sources
- FINRA, Dollar-Cost Averaging
- U.S. Securities and Exchange Commission, Ten Things to Consider Before You Make Investing Decisions
- Merrill / Bank of America, What Is Dollar-Cost Averaging?
- Forbes, How Dollar-Cost Averaging Stacks Up Against Lump-Sum Investing (Vanguard and Shiller data)
- Northwestern Mutual, Is Dollar-Cost Averaging Better Than Lump-Sum Investing?
- Schwab Center for Financial Research, Does Market Timing Work?