Fact-checked by the MyFinancial101 editorial team
Quick Answer
Choosing between a robo-advisor and self-directed investing comes down to three factors: cost discipline, time, and behavior. Robo-advisors charge a median 0.25% annual fee and automate rebalancing and tax-loss harvesting, while self-directed ETF portfolios can run at under 0.05% in expense ratios. Disciplined DIY investors who never panic-sell and manually rebalance will likely come out ahead over 20 years. Everyone else probably won’t.
The robo-advisor vs. self-directed debate has a clear answer for most people, and it’s not the one you expect. Despite charging a median annual fee of 0.25% of assets under management according to Morningstar’s 2024 evaluation of 16 providers, robo-advisors consistently outperform the majority of people who manage their own portfolios. The reason isn’t sophistication. It’s that most self-directed investors make expensive behavioral mistakes that erase the fee advantage before it ever compounds.
Robo-advisor assets under management reached between $634 billion and $754 billion in the U.S. in 2024, according to Cerulli Associates data cited by Morningstar. That’s still a fraction of the $36.8 trillion U.S. retail investment market, but the growth reflects a real shift. Platforms like Betterment, Wealthfront, and Schwab Intelligent Portfolios have matured, adding tax-loss harvesting, goal-based planning, and hybrid human access. Meanwhile, commission-free brokerages have made self-directed investing cheaper than ever. The conditions for a fair comparison finally exist.
This guide is for investors deciding where to put new money, considering switching approaches, or managing both strategies in parallel. By the end, you’ll have a data-backed framework to match your situation to the method most likely to grow your money faster, not just in theory, but in practice.
Key Takeaways
- Robo-advisors charge a median 0.25% annual advisory fee, per Morningstar’s 2024 robo-advisor report. On a $250,000 portfolio, that’s $625 per year compounding against you.
- Three-year annualized returns (net of fees) for robo 60/40 portfolios ranged from 3.98% to 5.96%, according to SoFi’s industry data compilation. Provider selection matters significantly.
- Self-directed index ETF portfolios can run at under 0.05% in annual expense ratios, making them the lowest-cost option available, provided the investor maintains discipline and never panic-sells.
- U.S. robo-advisor AUM reached between $634 billion and $754 billion in 2024, per Morningstar’s analysis of Cerulli Associates data, showing sustained institutional confidence in the model.
- The SEC holds robo-advisors to the same fiduciary standard as human advisers under the Investment Advisers Act of 1940, meaning they are legally required to act in your best interest.
- Multiple studies show average self-directed investors underperform their benchmark index by 1% to 2% annually due to behavioral timing errors, a gap that compounds to tens of thousands of dollars over a 20-year horizon.
In This Guide
- Step 1: Calculate the Real Cost Difference Between Robo and Self-Directed
- Step 2: Compare Historical Returns, Robos vs. DIY Investors
- Step 3: Understand Where Automation Pulls Ahead
- Step 4: Measure the Hidden Cost of Investing Solo
- Step 5: Match the Right Approach to Your Situation
- Frequently Asked Questions
Step 1: Calculate the Real Cost Difference Between Robo and Self-Directed
Fees don’t just reduce your balance once. They reduce the base on which every future gain compounds, which means the drag accelerates over time. On a $50,000 portfolio with a 7% gross annual return, a 0.25% robo advisory fee costs roughly $1,900 over 10 years and nearly $7,500 over 20 years in foregone growth compared to a fee-free alternative. Scale that to $250,000 and the 20-year difference exceeds $37,000.
How to Do This
Start with a simple three-column comparison. List your current or anticipated portfolio balance, apply a 7% gross annual return (a reasonable long-run equity assumption), and run the math at three fee levels: 0.25% (median robo), 0.05% (typical self-directed index ETF expense ratio), and 0.00% (a true zero-cost benchmark). The difference at 20 years between 0.25% and 0.05% on a $100,000 starting balance is approximately $10,500. That gap is real money, not a rounding error.
Self-directed investors using Vanguard, Fidelity, or iShares ETFs can build a diversified three-fund portfolio at expense ratios below 0.05%. That’s your actual cost floor. Robo-advisors layer their advisory fee on top of underlying fund expenses, so the all-in cost is slightly higher than the 0.25% headline. Betterment, for example, discloses that its underlying ETF expense ratios add roughly 0.06% to 0.13% on top of its management fee.
What to Watch Out For
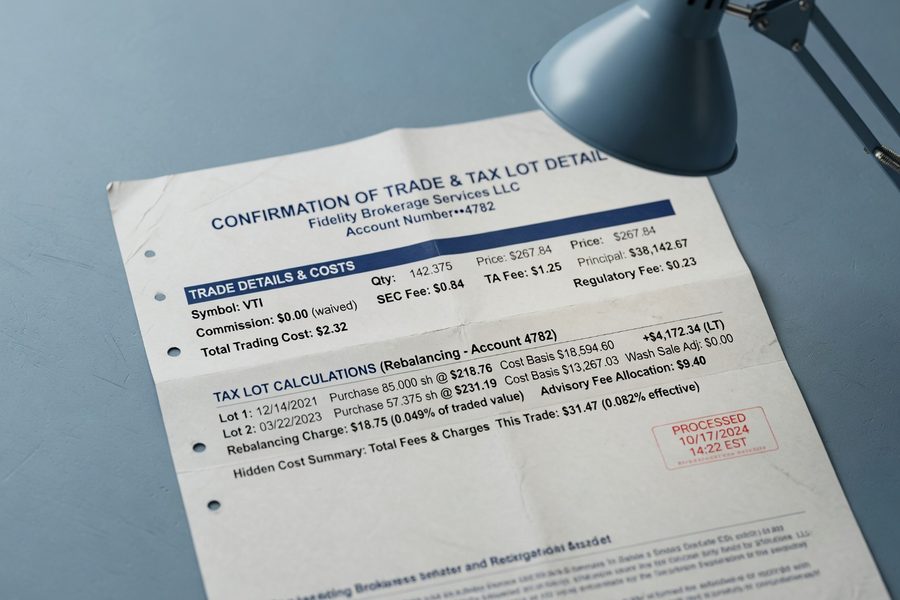
Some self-directed investors underestimate their hidden costs: trading commissions on individual stocks (where applicable), tax drag from frequent rebalancing, and the time cost of managing the portfolio. If you value your time at $30 per hour and spend 40 hours annually on your portfolio, that’s $1,200 in implicit cost per year, which can close the gap with a robo quickly on smaller balances. The fee advantage of going DIY is real, but it only materializes if your time is genuinely free and your discipline is consistent.
A self-directed three-fund ETF portfolio at Vanguard or Fidelity can cost under 0.05% annually. The median robo-advisor charges 0.25% per year. On a $200,000 portfolio held for 20 years at 7% gross returns, that 0.20% difference compounds to over $21,000 in additional wealth for the self-directed investor, assuming identical gross performance.
Step 2: Compare Historical Returns, Robos vs. DIY Investors
The fee math favors self-directed investing. The behavioral data does not. This is the tension at the center of the robo-advisor vs. self-directed question, and most guides skip past it too quickly.
How to Do This
Look at two sets of numbers side by side: robo-advisor net returns and average DIY investor returns versus their benchmark. For robos, SoFi’s compilation of industry return data shows three-year annualized trailing returns for 60/40 robo portfolios ranging from 3.98% to 5.96% as of November 30, 2024. The spread is wide, which means provider selection matters more than most people assume.
For DIY investors, the picture is less flattering. Behavioral finance research consistently finds that the average self-directed retail investor underperforms their own fund’s stated return by 1% to 2% per year, a phenomenon Morningstar calls the “investor return gap.” The cause is predictable: buying after rallies and selling during drawdowns. Over 20 years, a 1.5% annual drag on a $100,000 portfolio compounds to roughly $60,000 in lost wealth versus simply holding the index and doing nothing.
Betterment and similar platforms documented a 12.67% behavioral advantage versus self-directed investors during the March 2020 crash, specifically by preventing emotional exits at the bottom. Whether that advantage has persisted through the higher-rate, higher-volatility environment of 2024 through 2026 is less clear. But the mechanism hasn’t changed: robo algorithms don’t panic.
What to Watch Out For
Survivorship bias distorts DIY success stories. The investors who share their 15% annual returns on financial forums are not a representative sample. The median DIY investor, by multiple independent analyses, does not beat a simple S&P 500 index fund over 10-year periods. If you’re genuinely among the disciplined minority who rebalances on schedule, never sells in a panic, and keeps costs low, you likely don’t need a robo. Most people are not in that group, and very few correctly self-identify.
Comparing robo-advisor returns to a pure equity index is a category error. Most robos run 60/40 or similar mixed portfolios. A fair comparison is robo net returns versus a self-directed 60/40 portfolio of equivalent allocation. Self-directed investors who compare their robo’s 5% net return to an all-equity benchmark are doing the math wrong.
Step 3: Understand Where Automation Pulls Ahead
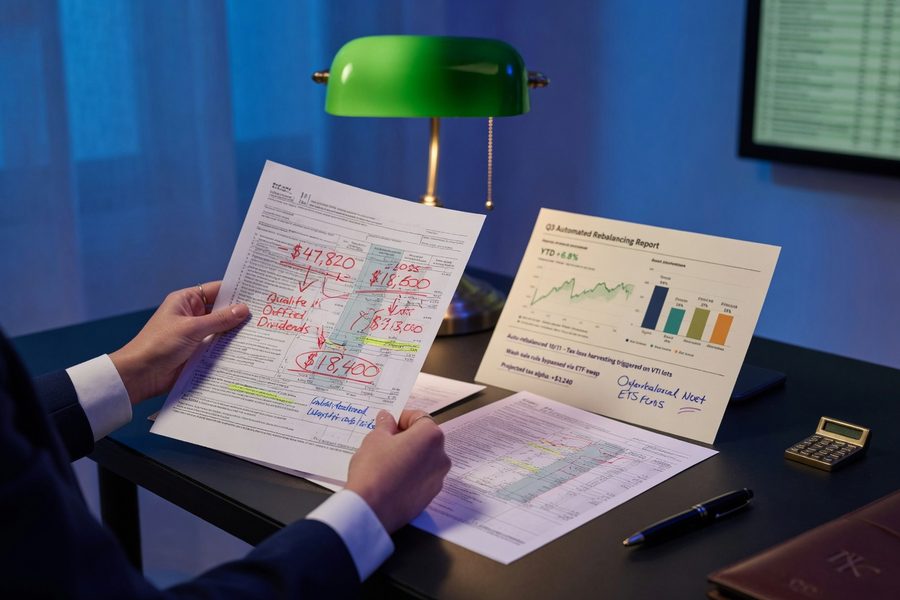
Tax-loss harvesting alone can add 0.5% to 1.5% annually to after-tax returns in taxable accounts, according to Betterment’s internal modeling. That’s enough to close most of the fee gap and then some.
Robo platforms handle three tasks automatically that self-directed investors must execute manually: rebalancing when allocations drift, reinvesting dividends immediately, and harvesting tax losses throughout the year. Each is individually simple, but the combination, done consistently and without emotional interference, produces a compounding after-tax advantage. Wealthfront’s direct indexing product, available at higher balance tiers, takes this further by harvesting losses at the individual security level rather than the fund level, extracting more tax alpha than most DIY investors can replicate.
Tax-loss harvesting only benefits investors holding assets in taxable brokerage accounts. In a 401(k) or IRA, there are no capital gains taxes to offset, so this robo feature has zero value. If your entire portfolio sits in tax-advantaged accounts, the automation argument for robos weakens considerably.
Step 4: Measure the Hidden Cost of Investing Solo
Behavioral risk is the most underpriced variable in personal investing. The cost shows up not as a line item, but as the gap between what your portfolio returned and what it should have returned.
How to Do This
Honest self-assessment here is more valuable than any tool. Ask three specific questions. First: did you sell anything during the 2022 bear market, the March 2020 crash, or any other correction? Second: did you delay investing because you were waiting for a better entry point? Third: do you hold more than 5% of your portfolio in individual stocks you selected based on your own research? A “yes” to any of these is evidence of the behavioral patterns that cost self-directed investors their fee advantage.
The Financial Industry Regulatory Authority (FINRA) has noted that digital investment tools, including robo-advisors, provide a rules-based framework that removes the most expensive investor behaviors from the equation. That’s not a small thing. Rules-based allocation enforced by an algorithm is structurally resistant to the emotional cycles that govern most human portfolio decisions. If you find yourself checking your balance daily during a market drop, a robo-advisor is probably worth the 0.25% fee as behavioral insurance alone.
“I kind of think of robos as a tool that you use in your tool belt for the investment management component.”
That framing is precise. A robo-advisor is not a complete financial plan. It handles allocation and execution. The broader decisions: when to start, how much to save, how to handle a job change or major purchase, those require judgment that algorithms don’t provide. If you’re still building the foundation of your investing knowledge, a resource like this guide to investing with zero experience covers that groundwork before you pick a platform.
What to Watch Out For
Overconfidence is the most documented bias in retail investing. Studies show that individual investors consistently rate their own market knowledge and discipline as above average, and the data consistently shows the opposite. The self-directed investors who actually outperform tend to be ones who hold low-cost index funds passively, which is ironically the same thing a robo-advisor does, just without the fee.
“A robo advisor can be helpful up to a certain point, but you are unlikely to get access to the best products in the public markets or in the best products in the private markets.”
Step 5: Match the Right Approach to Your Situation
No single approach wins for every investor. The right answer depends on portfolio size, time availability, tax situation, and, most critically, your demonstrated behavior during previous downturns.
How to Do This
Use the comparison table below to identify which profile most closely matches yours. Then read the nuances beneath it, because the categories are not rigid.
| Investor Profile | Recommended Approach | Primary Reason | Estimated Annual Cost |
|---|---|---|---|
| Beginner, under $25k | Robo-advisor | Automation prevents early behavioral mistakes | ~0.25% ($63/yr on $25k) |
| Disciplined passive investor, any balance | Self-directed index ETFs | Lowest cost, no behavioral issues to offset | <0.05% ($50/yr on $100k) |
| Busy professional, $50k–$250k | Robo-advisor | Tax-loss harvesting and rebalancing outweigh fee cost | ~0.25%–0.40% all-in |
| Active stock picker, $50k+ | Hybrid: robo core + self-directed satellite | Limits behavioral risk to a defined portion | Varies by split |
| High-net-worth, $500k+ | Human advisor or direct indexing | Complex tax, estate, and planning needs exceed robo scope | 0.50%–1.00%+ |
| Retirement accumulator, 20+ yr horizon | Self-directed three-fund portfolio | Fee compounding matters most over long horizons | <0.05% |
The hybrid approach deserves specific attention. Keeping 70% to 80% of your portfolio in a robo-managed core (for discipline and tax efficiency) while directing the remaining 20% to 30% into individual ETFs or stocks you’ve researched gives you both behavioral guardrails and the flexibility to express views. This is particularly relevant for investors who have high-conviction positions in sectors they know deeply. The key constraint: keep the self-directed satellite to a fixed, predetermined percentage. Letting it grow unchecked is how the behavioral risk bleeds back in.
For investors who have high-interest debt alongside investment accounts, the calculus shifts entirely. Paying down credit card debt before prioritizing investments often produces better risk-adjusted returns than either a robo or self-directed approach. No investment reliably returns 20%+ annually to justify carrying high-rate debt.
“Where a human financial advisor really thrives is addressing the other 90% of your financial life. The big questions, like how to buy a house, a car, quit your job and start your own business, or have a baby in the next five or 10 years.”
That observation also applies to the robo-advisor vs. self-directed choice: the investment management method is a secondary decision. Savings rate, asset allocation, and tax account selection, Roth IRA vs. traditional 401(k), for instance, drive far more of your long-run outcome than whether you pay 0.25% to a robo or 0.05% to Vanguard. If you’re still building the savings foundation, a related resource on prioritizing retirement savings over college funding addresses where to direct money before the investment method even matters.
What to Watch Out For
One honest concession: pure self-directed index investing in a low-cost three-fund portfolio at Vanguard or Fidelity mathematically outperforms both robos and human advisors for investors who maintain discipline. The academic evidence on this is not ambiguous. The caveat is behavioral, not analytical. If you have a documented history of steady, unemotional investing across multiple market cycles, the fee savings of going self-directed are genuinely worth capturing. If you don’t have that history yet, paying a robo’s 0.25% for enforced discipline is a reasonable price.
The North American Securities Administrators Association (NASAA) recommends verifying that any robo-advisor is properly registered with the SEC or state regulators before investing. You can check registration status at the SEC’s investment adviser registry. Registered robo-advisors carry the same fiduciary obligations as traditional investment advisors under the Investment Advisers Act of 1940.

Also worth noting: the best time to make this decision is before a market correction, not during one. If you find yourself reading this article after a 15% drawdown and considering a switch to a robo, that emotional timing is itself the behavioral risk at play. The platform choice matters less than locking in a process you’ll actually follow through a full market cycle. And if you’re in an income-building phase where every dollar you invest matters, sources like micro-freelancing income opportunities can accelerate how quickly you reach the balance thresholds where robo features like tax-loss harvesting deliver real value.
Frequently Asked Questions
Can a robo-advisor really beat a self-directed investor over 20 years?
For most investors, yes. The robo won’t beat a disciplined self-directed index investor on gross returns, but it outperforms the average DIY investor by removing behavioral timing errors that cost 1% to 2% annually. Over 20 years, behavioral alpha from staying invested through downturns compounds more than the fee savings of going solo.
What is the actual all-in cost of a robo-advisor vs. managing my own portfolio?
The median robo-advisor charges 0.25% annually in advisory fees, per Morningstar’s 2024 evaluation, plus underlying ETF expense ratios of roughly 0.06% to 0.13%. Self-directed portfolios using Vanguard or iShares index ETFs typically run under 0.05% total. On a $150,000 portfolio, that’s roughly $375 to $570 per year for robo versus $75 or less for self-directed.
How do I know if I’m a disciplined enough investor to go self-directed?
Review your trading history during the 2022 bear market and the March 2020 crash. If you sold anything during either event, or delayed adding money because the market felt uncertain, you are not among the behaviorally disciplined minority. One panic sell in 20 years can erase the entire fee advantage of self-directed investing.
Should I use a robo-advisor if I have a small portfolio under $10,000?
A robo-advisor is a strong default for portfolios under $10,000. The absolute dollar cost of a 0.25% fee is small ($25 per year on $10,000), the automation prevents early behavioral mistakes, and the discipline instilled early compounds as the portfolio grows. A target-date fund inside a Roth IRA achieves similar benefits at even lower cost.
Does tax-loss harvesting from a robo-advisor actually make a meaningful difference?
In taxable accounts, yes. Betterment’s modeling estimates tax-loss harvesting adds 0.77% annually after taxes for typical investors, which more than offsets the 0.25% advisory fee. The benefit is largest in volatile years with significant market swings and disappears entirely inside 401(k) or IRA accounts where capital gains are already sheltered.
Which robo-advisor has the best returns?
Return ranges vary significantly by provider and portfolio construction. Among robo 60/40 portfolios, the three-year annualized range ran from 3.98% to 5.96%. Betterment and Wealthfront consistently rank near the top of independent evaluations. Choose based on fee structure, tax features, and account minimums, not trailing returns alone, which are highly sensitive to evaluation period.
Is a robo-advisor safe if the company goes bankrupt?
Yes, with qualifications. Robo-advisors registered with the SEC are subject to the same fiduciary rules as traditional advisers under the Investment Advisers Act of 1940. Your assets are held at a custodian (typically a SIPC-insured broker-dealer), not at the robo company itself. If the robo goes out of business, your underlying ETFs are still yours. SIPC coverage protects up to $500,000 in securities.
Can I combine a robo-advisor with self-directed investing at the same time?
Absolutely, and for many investors this is the optimal structure. Keeping a robo-managed core (60% to 80% of assets) for discipline and tax efficiency while directing the remainder into self-selected ETFs or individual stocks is a practical hybrid. The key is setting the satellite percentage in advance and not adjusting it based on market conditions.
Should I use a robo-advisor or pay down debt first?
Pay down high-interest debt first. No robo-advisor or self-directed strategy reliably returns more than 20% annually, so carrying credit card debt while investing is a guaranteed negative spread. Once high-rate debt is cleared, especially anything above 7% to 8% APR, both robo and self-directed investing become productive. If managing debt is the current priority, resources on negotiating your credit card APR can reduce that rate before you focus on building an investment portfolio.
Sources
- Morningstar, Best Robo-Advisors: Robo-Advisor AUM and Market Data (2025)
- SoFi, Robo-Advisor Returns: Industry Data on 3-Year Annualized Performance (2025)
- Truthifi, Robo-Advisor vs. Human Financial Advisor: Morningstar Fee Data (2025)
- U.S. Securities and Exchange Commission, IM Guidance Update: Robo-Advisers and Fiduciary Standards (2017)
- FINRA, Report on Digital Investment Advice: Suitability, Conflicts, and Algorithm Supervision
- NASAA, Investor Education: Robo-Advisers Registration and Evaluation Guide
- NerdWallet, Financial Advisor vs. Robo-Advisor: Expert Perspectives (2024)
- The Wall Street Journal, Robo-Advisors vs. Financial Advisors: CFP Expert Quotes (2024)