Fact-checked by the MyFinancial101 editorial team
Quick Answer
For most people, cash flow deserves more daily attention than net worth. Cash flow determines whether you can cover this month’s bills without liquidating assets, while net worth is a snapshot that can swing 10–20% in a year due to market moves alone. Both numbers matter, but cash flow is the one you can actually control.
Cash flow vs. net worth is one of those debates where the conventional wisdom points in the wrong direction. Personal finance culture has long celebrated net worth milestones, the first $100,000, the elusive million, while largely treating monthly cash flow as a bookkeeping detail. That prioritization gets the relationship backwards. A household sitting on a $900,000 net worth concentrated in a primary residence and a 401(k) can still come up short when the water heater fails in January.
The Federal Reserve’s Financial Accounts of the United States put total U.S. household net worth at $163.8 trillion in the second quarter of 2024. That headline figure is staggering, yet the same period saw millions of households carrying high-interest credit card balances and living without an adequate emergency fund, because paper wealth and spendable income are not the same thing. According to the Federal Reserve Bank of St. Louis’s analysis of the 2022 Survey of Consumer Finances, median liquid assets represented just 14.9% of income for U.S. households, meaning most families hold most of their wealth in forms they cannot quickly spend.
This guide breaks down exactly what each number measures, why the distinction matters more in a high-rate, high-inflation environment, and how to decide which metric deserves your attention right now. You will come away with a concrete framework, not just general principles.
Key Takeaways
- Total U.S. household net worth reached $163.8 trillion in Q2 2024 (Board of Governors of the Federal Reserve System, 2024), yet median liquid assets were only 14.9% of income, showing how little of that wealth is immediately accessible.
- Net worth is a stock measure (a balance-sheet snapshot), while cash flow is a flow measure that shows how net worth is likely to change over time (Federal Reserve Bank of St. Louis Education Resources).
- Market volatility can move a diversified portfolio’s value by 10–20% in a single year with no change in spending or income, making net worth an unreliable short-term signal for most households.
- A household with $5,000/month of positive cash flow and a modest starting net worth will consistently build wealth, whereas a millionaire with negative cash flow is drawing down assets, a pattern the CFPB flags as a key driver of late-career financial distress.
- In retirement planning, the standard 4% sustainable withdrawal rate framework (widely cited by Vanguard and Morningstar research) is a cash flow calculation dressed up in net worth language. The goal is reliable monthly income, not a preserved balance.
- Positive cash flow is a prerequisite for net worth growth in any repeatable way; without it, net worth gains typically rely on one-time windfalls, asset appreciation, or debt, none of which are under consistent personal control.
In This Guide
- What Cash Flow and Net Worth Actually Measure
- Why Most People Over-Focus on Net Worth
- Cash Flow as the Real Driver of Financial Freedom
- Net Worth as the Long-Term Scoreboard
- Which Metric Matters Most at Different Life Stages
- How the Two Numbers Interact and Reinforce Each Other
- What Inflation and Higher Rates Do to Each Number
- A Simple Framework for Deciding What to Watch Right Now
What Cash Flow and Net Worth Actually Measure
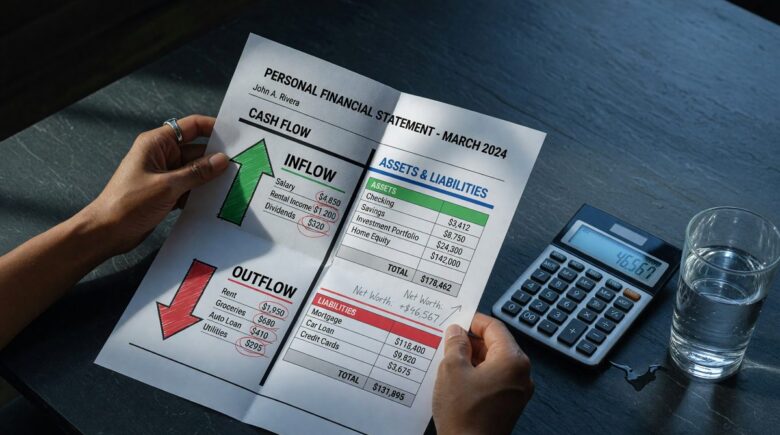
Your financial balance sheet captures a single moment in time: everything you own minus everything you owe. That is net worth. Monthly cash flow is something different, the speed and direction of money moving through your life over a given period. The Federal Reserve Bank of St. Louis defines net worth as a stock or inventory measure of current financial standing, and cash flow as a flow measure that indicates how net worth is likely to change over time. That distinction is not just semantic. It tells you which number is the cause and which is the effect.
Net worth is a stock or inventory measure of current financial standing, while cash flow is a flow measure indicating how net worth is likely to change over time.
The Formulas in Plain Language
Net worth = Total assets (home equity, investment accounts, savings, personal property) minus total liabilities (mortgage balance, auto loans, student loans, credit card balances). If your assets total $350,000 and your debts total $220,000, your net worth is $130,000.
Cash flow = Total monthly income minus total monthly expenses. If you bring home $6,500 after tax and spend $5,800 on housing, food, transportation, insurance, subscriptions, and discretionary items, your monthly cash flow is positive $700. That $700 is the fuel available for debt repayment, investing, or saving, and it exists regardless of what the stock market does overnight.
Why One Feels Actionable and the Other Feels Abstract
A $200 rent increase lands immediately. A $150 grocery bill for the week is tangible in a way that a portfolio balance simply is not. A net worth figure, by contrast, is something most people calculate once a year, if that, and it shifts with every market session whether they act or not. This difference in immediacy explains why cash flow problems tend to generate real financial stress while net worth changes, especially paper gains in a bull market, can feel theoretical until a withdrawal is actually needed.
According to the Federal Reserve Bank of St. Louis’s analysis of the 2022 Survey of Consumer Finances, median liquid assets for U.S. households were just 14.9% of income, meaning the vast majority of household wealth is held in illiquid forms like real estate and retirement accounts that cannot easily be converted to pay this month’s bills.
Why Most People Over-Focus on Net Worth
The cultural emphasis on net worth is understandable, but it distorts financial decision-making in ways that are genuinely costly. Apps like Personal Capital (now Empower), Mint, and a dozen investment platforms present net worth as the headline metric, updated in real time. Social media amplifies this: personal finance influencers regularly post net worth milestones and charts showing a climbing number. The number feels like a score, and scores are satisfying to watch.
The Psychological Comfort of a Big Number
A rising net worth provides a sense of progress that a budget spreadsheet rarely matches emotionally. Behavioral finance research consistently shows that people weight visible, memorable numbers more heavily than abstract flows, a bias sometimes called the salience effect. Watching a retirement account climb from $80,000 to $95,000 in a quarter feels like winning, even if monthly expenses also grew by $400 and the household is financing that growth with credit card debt. The net worth number masked the cash flow problem.
This is not a trivial quirk. Households that focus primarily on net worth milestones without tracking monthly cash flow can spend years accumulating assets while quietly accumulating high-interest debt on the side. When those two trends collide, as they do during job loss, medical events, or interest rate resets on variable debt, the net worth figure offers no immediate relief because the assets are locked up or would incur tax consequences to access.
A net worth figure inflated by home equity or retirement account balances can create a false sense of security. Neither asset type is immediately liquid: a home sale typically takes 30–90 days and incurs 5–6% in transaction costs, while early 401(k) withdrawals trigger income tax plus a 10% penalty for those under age 59½ (IRS rules). Do not confuse paper wealth with financial stability.
Cash Flow as the Real Driver of Financial Freedom
Positive monthly cash flow is the only financial metric that directly determines whether you can pay this month’s bills without selling assets or incurring new debt. Everything else, net worth growth, investment returns, debt payoff, depends on having surplus cash first. A $1 million net worth concentrated in a primary residence and a 401(k) produces exactly $0 in spendable monthly income until converted, a process that takes time, triggers taxes, and carries transaction costs.
The Cash-Poor Millionaire Problem
Consider a homeowner in a high-cost metro area with a $750,000 home, a $300,000 mortgage, and $150,000 in a 401(k). Net worth: approximately $600,000. Monthly cash flow: potentially negative, if the mortgage payment, property taxes, insurance, and maintenance consume most of a $95,000 household income. This household looks wealthy on paper but faces real monthly pressure. Selling the home solves the net worth-to-cash problem but eliminates housing, so the trade-off is not trivial.
Contrast that with a renter earning $75,000 who carries no debt, spends $3,200/month, and invests $1,500/month. Net worth might be $80,000, a fraction of the homeowner’s. But that household’s positive surplus is building net worth predictably, month after month, with no forced-sale risk. Over a decade, the math usually favors the consistent cash flow generator. If you are thinking about how to start investing with zero prior experience, monthly surplus is the prerequisite, not the other way around.
Cash Flow, Stress, and Real-Life Resilience
Research from the CFPB and the Financial Health Network consistently links negative or near-zero monthly cash flow to elevated financial stress, higher rates of payday loan use, and worse health outcomes. The mechanism is direct: when income barely covers expenses, any unexpected cost, a $400 car repair, a $1,200 ER copay, creates a liquidity crisis that has nothing to do with net worth. Having $500/month of positive cash flow acts as a structural buffer; having a $200,000 brokerage account does not, unless you are willing and able to liquidate quickly.

Total U.S. household net worth stood at $163.8 trillion in Q2 2024 according to the Federal Reserve’s Financial Accounts of the United States, yet millions of those same households carried revolving credit card balances at rates exceeding 20% APR, a direct indicator that aggregate net worth figures hide severe cash flow problems at the household level.
Net Worth as the Long-Term Scoreboard
Over a 20- or 30-year horizon, net worth growth is the most direct indicator of financial independence, the point at which your assets can generate enough income to replace your labor. Think of it as the cumulative score, not the play-by-play. It earns its place in a financial plan as the long-term measure of whether compounded cash flow decisions are actually working.
The key caveat: net worth is most useful when examined over multi-year periods, not month to month. A portfolio that drops 15% in a correction has not changed your financial behavior or your earning power. Treating that as a crisis is a behavioral mistake that leads to the most costly investing error of all: panic selling. Steady cash flow inflows during a downturn, continuing to invest $500/month while markets fall, actually accelerate long-term net worth growth through dollar-cost averaging into lower prices.
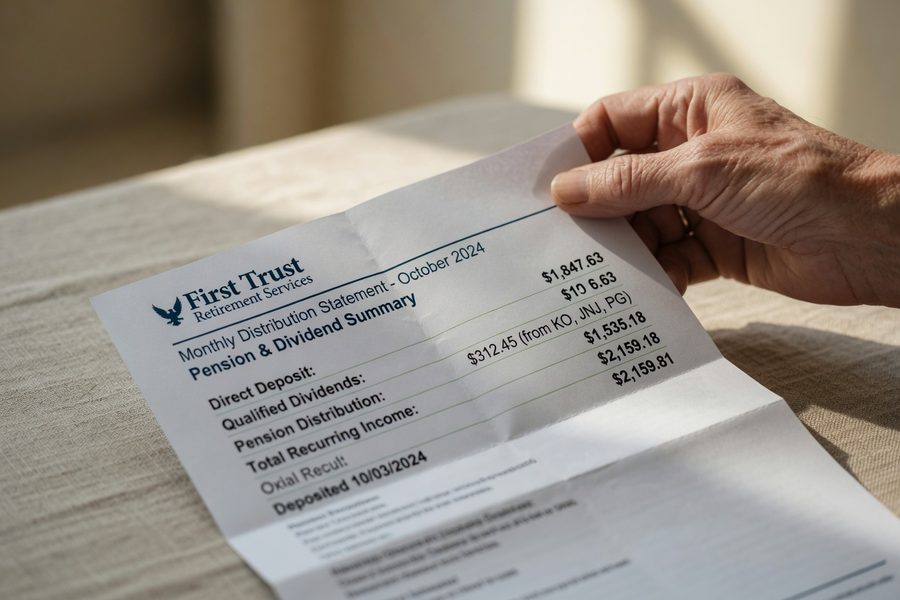
In retirement planning, the widely cited 4% sustainable withdrawal rate from Bengen’s 1994 research (and subsequent Vanguard and Morningstar analyses) is a cash flow target. A retiree with $1 million in assets is not managing a $1 million number, they are managing roughly $40,000/year in reliable income. The portfolio is simply the vehicle; monthly income is the destination.
Which Metric Matters Most at Different Life Stages
The honest answer is that the more important number shifts across a lifetime, and getting the sequence right matters enormously. Optimizing for net worth in your 20s, by locking money in illiquid investments before you have a cash flow cushion, is a common and expensive mistake. Obsessing over monthly cash flow in your 60s at the expense of portfolio positioning is equally misaligned.
Early Career: Cash Flow Is the Priority
Before age 35, the primary financial task is escaping the paycheck-to-paycheck cycle. That means building positive cash flow first. Every dollar of monthly surplus is the seed capital for everything else: an emergency fund, debt repayment, and eventual investing. A balance sheet at this stage is almost certainly low and volatile, and that is fine. The goal is not to maximize net worth yet; it is to generate consistent monthly surpluses that can be directed productively. If your income has gaps or you are in a gig-based role, resources like micro-freelancing opportunities can help bridge cash flow shortfalls while you build toward stability.
Mid-Life Accumulation: Manage Both, but Actively
From roughly 35 to 55, the calculus changes. Debt levels are often highest (mortgage, possibly student loans still, auto financing), income is usually near its peak, and the compounding window for retirement investing is wide open. At this stage, both metrics deserve attention on a quarterly basis. The risk here is a classic one: aggressively paying down a low-rate mortgage to build net worth while carrying high-interest credit card balances that destroy cash flow. Paying down a 7% mortgage when you carry a 22% credit card balance is a financial error that shows up in net worth calculations only slowly but damages cash flow immediately. For households wrestling with this priority question, a clear guide to credit card debt prioritization and creditor negotiation can clarify the sequencing.
Pre- and Post-Retirement: Shift Back to Cash Flow
Approaching and entering retirement, the net worth number becomes almost secondary to a single, concrete question: can your assets reliably generate enough monthly income to cover your expenses for 25–30 years? A $1.2 million portfolio is not inherently safer than an $800,000 portfolio if the $800,000 household has lower fixed expenses, Social Security income, and a clear withdrawal plan. Portfolio design at this stage is about structuring predictable cash flow, not maximizing a balance.
| Life Stage | Primary Focus | Secondary Focus | Key Risk to Avoid |
|---|---|---|---|
| Early Career (20s–early 30s) | Build positive monthly cash flow | Start net worth with emergency fund | Locking money in illiquid assets before having a buffer |
| Mid-Life (35–55) | Balance both; eliminate high-interest debt | Accelerate retirement account contributions | Paying low-rate debt while carrying high-rate balances |
| Pre-Retirement (55–65) | Shift to income-producing assets | Reduce sequence-of-returns risk | Overconcentration in growth assets without income |
| Retirement (65+) | Reliable monthly income (cash flow) | Portfolio longevity (real net worth) | Withdrawing unsustainably from a declining portfolio |
How the Two Numbers Interact and Reinforce Each Other
Positive cash flow is the primary engine that builds net worth over time. When you consistently spend less than you earn and direct the surplus into debt repayment or investment, net worth grows in a structured, repeatable way. When net worth grows, through compounding returns, equity accumulation, and asset appreciation, it eventually generates its own cash flow through dividends, rental income, interest, and withdrawal capacity. The relationship is circular, and understanding which direction the circle is turning for you right now is the core of personal financial clarity.
When Chasing Net Worth Hurts Cash Flow
The most common trap: purchasing an asset that inflates net worth on paper while straining monthly cash flow. A rental property purchased with a high mortgage in a low-yield market is the textbook example. The property might add $180,000 to your net worth column immediately, but if monthly rental income is $1,800 and mortgage, insurance, taxes, and maintenance total $2,100, you have a negative $300/month cash flow burden. You are wealthier on paper and poorer every 30 days. The same dynamic appears with concentrated stock positions that cannot be liquidated without triggering significant capital gains taxes: high net worth, constrained cash flow.
Debt payoff offers a nuanced version of this tension. Aggressively paying down a 3.5% mortgage improves net worth by reducing liabilities, but it does so at the cost of cash that could generate returns elsewhere or simply provide liquidity. In contrast, paying down a $15,000 credit card balance at 22% APR improves both net worth and cash flow simultaneously: the liability shrinks and the monthly minimum payment, often $300–$400, is freed up for other uses. That is why high-interest consumer debt repayment is one of the rare financial moves that genuinely optimizes both metrics at once.
Before making any large financial commitment, buying a property, taking on a loan, making a major purchase, run a quick cash flow impact test first. Ask: what does this do to my monthly income-minus-expenses number? A decision that looks smart on a net worth spreadsheet can silently erode your monthly financial stability for years.
What Inflation and Higher Rates Do to Each Number
Inflation and the post-2022 interest rate environment exposed a vulnerability that most net-worth-focused frameworks miss: rising prices and higher borrowing costs attack cash flow far more directly and immediately than they erode net worth on paper. This gap is one that most top financial guides have not addressed squarely.
When the Federal Reserve raised the federal funds rate from near zero to a target range of 5.25–5.50% between 2022 and 2023, household net worth figures in the S&P 500 dropped, but recovered within roughly 12 months for long-term investors who stayed invested. Cash flow, however, took structural hits that did not simply reverse. Variable-rate credit card APRs moved above 20% for the average cardholder, according to Federal Reserve Consumer Credit data. Auto loan rates climbed above 7–8% for new vehicles. Adjustable-rate mortgage holders saw monthly payments jump by hundreds of dollars on the same loan balance.
The Real Purchasing Power Problem
Inflation compounds the problem from the other direction. If your salary increases by 3% but grocery, housing, and insurance costs rise by 5–6%, your real monthly cash flow shrinks even though your nominal income grew. A home and equities, if they are part of your net worth, may actually rise in nominal terms during an inflationary period, because those assets are inflation-sensitive. The result is a household that looks wealthier on paper while experiencing genuine financial tightening every month. That divergence is not a paradox; it is a direct consequence of measuring two different things.
Tax-advantaged cash flow strategies can partially offset this. Roth IRA conversions, when timed during lower-income years, convert future taxable withdrawals into tax-free cash flow in retirement, a meaningful per-dollar improvement that does not immediately register in net worth figures. Rental property owners can use depreciation deductions under IRS rules to reduce taxable income, improving after-tax cash flow without changing the property’s market value. These strategies show up in cash flow first and net worth only indirectly over time.
The Federal Reserve Bank of St. Louis reports that median liquid assets represented just 14.9% of income for U.S. households in the 2022 Survey of Consumer Finances, meaning that even with record-high aggregate net worth, the typical household’s liquid cushion covers less than two months of income. In a high-rate environment, that margin is perilously thin.
A Simple Framework for Deciding What to Watch Right Now
Here is a direct answer before the details: if your monthly expenses exceed or closely match your monthly income, cash flow is your number. If you have consistent positive cash flow but feel like you are not getting ahead, net worth trend is your number. Most people fall into one of four positions, and each has a clear implied priority.
Four Positions and Their Implied Priorities
| Your Situation | Watch This First | Concrete Action | Net Worth Role |
|---|---|---|---|
| Negative cash flow (spending more than you earn) | Monthly cash flow, urgently | Cut fixed expenses; increase income; eliminate high-rate debt | Irrelevant until cash flow is positive |
| Break-even ($0–$200/month surplus) | Cash flow margin | Find one recurring cut or income source to create $300+/month buffer | Track annually, expect slow growth |
| Positive cash flow ($500+/month surplus) | Net worth trajectory | Ensure surplus is directed to highest-priority goal (debt, emergency fund, investing) | Review quarterly; set 5-year targets |
| High net worth, low liquidity (asset-rich, cash-tight) | Liquid cash flow | Evaluate asset mix; consider generating income from existing assets | Rebalance toward income-producing assets |
Tools That Keep Both Metrics Visible
You do not need sophisticated software. A monthly cash flow statement takes 20 minutes to build in a spreadsheet: income columns on the left, fixed and variable expenses on the right, surplus or deficit at the bottom. Tracking net worth is even simpler: a once-per-quarter tally of account balances and debt balances, subtracted. Empower (formerly Personal Capital) and YNAB automate both if you prefer connected tools, though their dashboards tend to surface net worth more prominently than cash flow, something to consciously counteract.
The goal is not to obsess over either number daily but to have a clear trend. Cash flow should improve quarter over quarter. Net worth should grow year over year. If either trend reverses for two consecutive periods without a known, temporary cause, that is the signal to investigate. Short-term fluctuations in either number, one bad spending month, a market correction, are noise. Sustained directional movement is information. For households looking to build income on the side to improve cash flow, jobs paying $19 or more per hour represent a direct path to widening that monthly surplus.

Real-World Example: Two Households, Same Net Worth, Different Outcomes
Consider an illustrative example: two households, each with a net worth of approximately $280,000 at age 40.
Household A owns a home with $210,000 in equity, has $55,000 in a 401(k), and $15,000 in a savings account. Monthly income: $7,200. Monthly expenses: $6,900. Monthly cash flow surplus: $300. That surplus is directed toward retirement contributions, giving them roughly $3,600/year in new invested assets.
Household B rents, carries no mortgage debt, has $180,000 in a brokerage account, $75,000 in a Roth IRA, and $25,000 in a high-yield savings account. Monthly income: $7,200. Monthly expenses: $5,400. Monthly cash flow surplus: $1,800. That surplus generates $21,600/year in new invested assets, six times Household A’s annual contribution rate.
At a 7% average annual return, Household B’s extra $1,500/month in investable cash flow compounds to approximately $735,000 in additional net worth over 20 years, purely from the cash flow advantage. Both households started with identical net worths at 40. By 60, the gap would be enormous, not because Household B was smarter about investing, but because positive cash flow gave them more to invest, consistently, over time.
The arithmetic: $1,500/month invested at 7% annually for 20 years = $1,500 x 521.3 (future value annuity factor for 240 months at 0.583% monthly rate) = approximately $781,950. Rounding to $735,000 is conservative given taxes and fees. Either way, the order of magnitude is instructive.
Your Action Plan
-
Calculate your actual monthly cash flow today
Add up every source of after-tax income for last month. Then add up every expense, fixed (rent, loan payments, insurance) and variable (groceries, gas, subscriptions, dining). Subtract expenses from income. If you do not know the number, use your bank’s transaction history or a free tool like Empower (app.empower.com) to pull 30 days of data. Do not estimate; get the real figure.
-
Identify your single largest cash flow leak
Look at the variable expense column and find the category with the most month-to-month variation. For most households it is dining out, subscriptions, or discretionary shopping. Pick one category and set a specific monthly cap, not a vague reduction goal but a dollar number, for example $200/month on restaurants instead of $420. Track it for 60 days before adding another constraint.
-
Eliminate high-interest debt in strict rate order
List every debt with its current balance and APR. Pay minimums on everything, then direct all surplus cash flow toward the highest-rate balance first (the avalanche method). A $10,000 credit card at 22% APR costs approximately $2,200/year in interest; paying it off improves both your cash flow (eliminated minimum payment) and your net worth (reduced liability). Use the strategy of negotiating your credit card APR before assuming the rate is fixed.
-
Build a quarterly net worth snapshot
Set a recurring calendar reminder for the first weekend of each quarter. Log every account balance (checking, savings, brokerage, 401(k), IRA, home equity estimate) and every liability balance. A simple spreadsheet with two columns, assets and liabilities, gives you a net worth number in under 10 minutes. Track the trend over 12 months; ignore individual quarter fluctuations driven by market moves.
-
Protect cash flow with a liquid emergency fund before investing aggressively
Before increasing retirement contributions beyond any employer match, build 3 months of essential expenses in a high-yield savings account (HYSA). As of mid-2026, many HYSAs at institutions like Marcus by Goldman Sachs, Ally Bank, and SoFi still offer competitive yields relative to inflation. This fund exists to prevent a cash flow emergency from becoming a net worth emergency through forced asset liquidation or new debt.
-
Align your investment contributions with your life stage
Use the table in the life stages section above to identify your current position. If you are in early career, prioritize cash flow and a $1,000 starter emergency fund before touching investment accounts beyond the employer match. If you are in mid-life accumulation, target maximum 401(k) and IRA contributions once high-interest debt is cleared. Consult why prioritizing retirement savings over college funding matters for your own financial security before directing cash flow toward others’ goals.
-
Review both metrics together once a year, not separately
Schedule one annual financial review, 90 minutes, no interruptions, where you look at trailing 12-month cash flow trend alongside year-over-year net worth change. Ask three questions: Did my monthly surplus grow? Did my net worth increase more than market returns alone would explain (meaning I added real value through savings)? Are my liquid assets sufficient to cover 3–6 months of expenses? If the answers are yes, yes, and yes, your financial plan is working. If any answer is no, that is next year’s priority.
Frequently Asked Questions
Is cash flow or net worth more important for financial health?
Cash flow is more important in the short and medium term because it determines whether you can meet obligations without incurring debt or liquidating assets. Net worth is more meaningful as a long-term measure of accumulated wealth. For most working-age adults, positive monthly cash flow is the prerequisite; net worth growth is the result.
Can someone have a high net worth but poor cash flow?
Yes, and it is more common than many expect. A homeowner with $600,000 in home equity and $200,000 in retirement accounts has a solid net worth, but if their mortgage, taxes, and insurance consume most of their take-home pay, their monthly cash flow can be negative. This situation is sometimes called being “house rich, cash poor,” and it creates real financial vulnerability despite an impressive balance sheet.
How often should I calculate my net worth?
Quarterly is ideal for most people; monthly is excessive and invites anxiety over market noise. A year-over-year comparison is the most informative frame. Net worth that grows 8–12% annually over a decade, largely through consistent investing of surplus cash flow, represents genuinely strong financial progress regardless of short-term swings.
Does paying off debt improve cash flow, net worth, or both?
Paying off debt improves net worth directly by reducing liabilities, and it improves cash flow by eliminating the monthly payment obligation. The magnitude of each effect depends on the debt type. Paying off a 22% credit card improves cash flow dramatically and quickly. Paying off a 3% mortgage improves net worth modestly and cash flow only slightly (by the freed minimum payment). Prioritize high-rate debt for the greatest combined effect.
What is a good monthly cash flow surplus?
There is no universal answer, but financial planners generally recommend targeting a surplus of at least 15–20% of gross income, equivalent to the widely cited “save 15% for retirement” guideline from institutions like Fidelity. For a household earning $6,000/month after tax, that implies a minimum $900–$1,200 monthly surplus directed to savings and investment. Below $500/month in surplus, most households lack adequate buffer for unexpected expenses.
How does inflation affect cash flow vs. net worth differently?
Inflation tends to inflate nominal net worth (home values and equity prices often rise with inflation) while simultaneously eroding real cash flow (the same income buys less each month). This divergence can make a household feel wealthier on paper while experiencing genuine financial tightening month to month. The 2022–2024 period demonstrated this clearly: aggregate household net worth reached record levels while consumer financial stress indicators, credit card delinquencies, and personal savings rates all deteriorated simultaneously.
Should I track both numbers in the same tool?
Tracking both in the same system is useful because it makes the causal relationship visible: sustained positive cash flow should produce rising net worth over time, with a lag of months to years depending on market conditions. Tools like Empower and YNAB can display both, though they weight net worth more prominently in their dashboards. A simple spreadsheet with one tab for monthly cash flow and one for quarterly net worth snapshots works equally well and often prompts more deliberate review.
Our Methodology
This article draws on verified institutional data from the Board of Governors of the Federal Reserve System, the Federal Reserve Bank of St. Louis, and the Federal Reserve’s Consumer Credit release (G.19). Net worth figures reference the Financial Accounts of the United States (Z.1 release, Q2 2024). Liquidity statistics are drawn from the Federal Reserve Bank of St. Louis’s analysis of the 2022 Survey of Consumer Finances, the most recent triennial survey available.
All statistics cited are linked directly to their primary source pages. No figures have been estimated or extrapolated beyond what the cited sources report. Interest rate figures reference Federal Reserve published data through mid-2026. The illustrative case study uses internally consistent arithmetic based on a standard future value of annuity formula at a 7% annual return assumption, a rate consistent with long-term historical U.S. equity returns net of inflation adjustments cited by sources including Vanguard and Morningstar in their long-term capital markets assumptions. Recommendations in this article reflect general personal finance principles and should not be construed as individualized financial advice.
Sources
- Board of Governors of the Federal Reserve System, Financial Accounts of the United States (Z.1), Q2 2024
- Federal Reserve Bank of St. Louis, Rising Liquidity of U.S. Households and Policy Implications (2024)
- Federal Reserve Bank of St. Louis Education Resources, Net Worth and Cash Flow Definitions
- Federal Reserve, Consumer Credit (G.19 Release), Current
- Federal Reserve, Survey of Consumer Finances 2022 Summary
- Internal Revenue Service, Retirement Topics: Early Distributions and the 10% Penalty
- Federal Reserve, Open Market Operations and Federal Funds Rate History
- Internal Revenue Service, Publication 946: How to Depreciate Property
- Fidelity Investments, How Much Should You Save for Retirement?