Fact-checked by the MyFinancial101 editorial team
The Verdict
Adjusting your shopping habits for inflation in 2026 is worth it if the CPI is running at 4.2% or higher and your income has not kept pace, which describes most American households right now. It is less urgent only if your wages have outpaced inflation by a meaningful margin and you carry no consumer debt tied to variable rates.
Here is the counterintuitive part: the consumers making the sharpest behavioral changes in 2026 are not necessarily the ones hurting the most. They are the ones paying attention. With the Consumer Price Index rising 4.2% year-over-year through May 2026, the steepest pace in three years, inflation shopping habits 2026 have moved from temporary workarounds to permanent rewiring. The single factor that swings every budget decision right now is whether your real (inflation-adjusted) income has kept up with that 4.2% headline number.
This matters now because the pressures driving the shift are not cyclical. Energy prices, tariff-driven goods costs, and shelter inflation are all pushing in the same direction at the same time. The Federal Reserve’s rate policy has cooled some demand, but it has not unwound the structural cost increases baked into housing, food supply chains, or import-dependent goods. Waiting to adapt is itself a financial choice, and not a neutral one.
| Factor | Reasons to Change Shopping Habits Now | Reasons to Hold Current Approach |
|---|---|---|
| Grocery costs | 39% of consumers already report spending more on groceries than a year ago | If you have locked in a CSA or bulk membership, your effective per-unit cost may already be optimized |
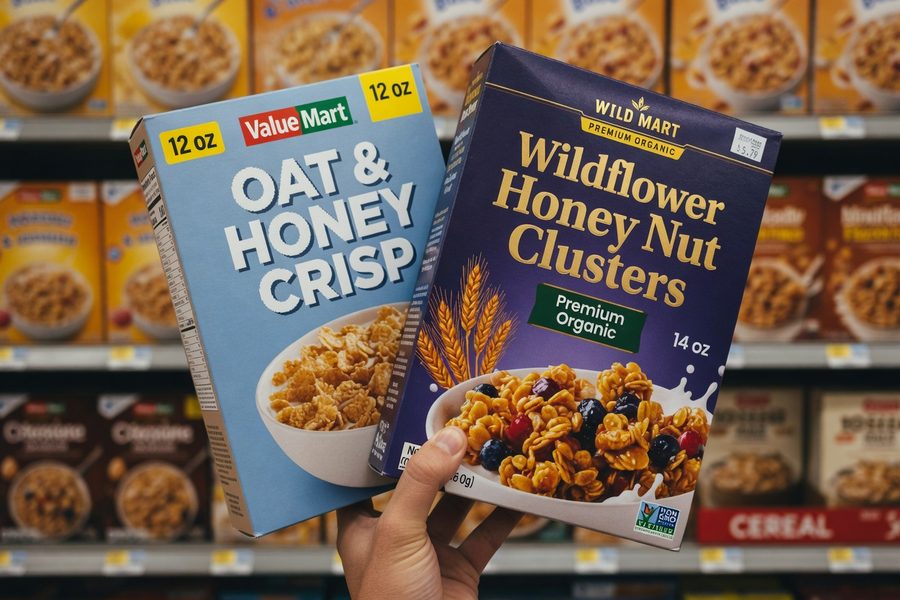
| Brand loyalty | 32% of shoppers are switching to lower-priced brands; quality gaps between private label and national brands have narrowed significantly | Brand switching has real time costs; not worth it on items where generics genuinely underperform for you |
| Energy exposure | Gasoline prices are up 40.5% year-over-year, compressing every transport-linked budget | Remote workers or EV owners face a much smaller share of this specific shock |
| Shrinkflation awareness | The GAO confirmed shrinkflation is real in packaged goods; cereal products alone saw downsized items hit 8.6% of category sales | Impact is smaller than perceived: GAO found it contributed less than 0.1 percentage points to the 34.5% price rise from 2019-2024 |
| Discretionary cuts | Two-thirds of consumers are already pulling back on wants; delaying non-essentials now avoids high-APR debt later | Cutting discretionary entirely can increase spending via pent-up demand rebounds; strategic moderation beats cold-turkey |
| Store switching | Price gaps between discount grocers and conventional chains have widened; comparison shopping across two stores can yield real savings on staples | Driving to a second store adds fuel cost and time; only worth it on large basket sizes above roughly $75-$100 per trip |
Key Takeaways
- Your household’s nominal income has risen less than 4.2% since May 2025, meaning real purchasing power has declined.
- You spend more than $200 per month on groceries, making a private-label switch worth testing across at least 5-8 staple categories.
- You are carrying variable-rate credit card debt above 20% APR, which makes every dollar of overspending on non-essentials actively destructive.
- Your gasoline budget has increased by more than $50 per month compared to early 2025, and you have not yet adjusted trip consolidation or routing habits.
- You have not audited subscriptions, streaming services, or recurring charges in the past six months, a likely source of $30-$80 in recoverable monthly spend.
- You are eating out more than three times per week while citing grocery costs as a pressure point, which is where the behavioral contradiction most often lives.
- Your savings rate is below 5% of take-home pay, leaving no buffer if energy or shelter costs spike further in the second half of 2026.
What a 4.2% CPI Actually Costs a Typical Household
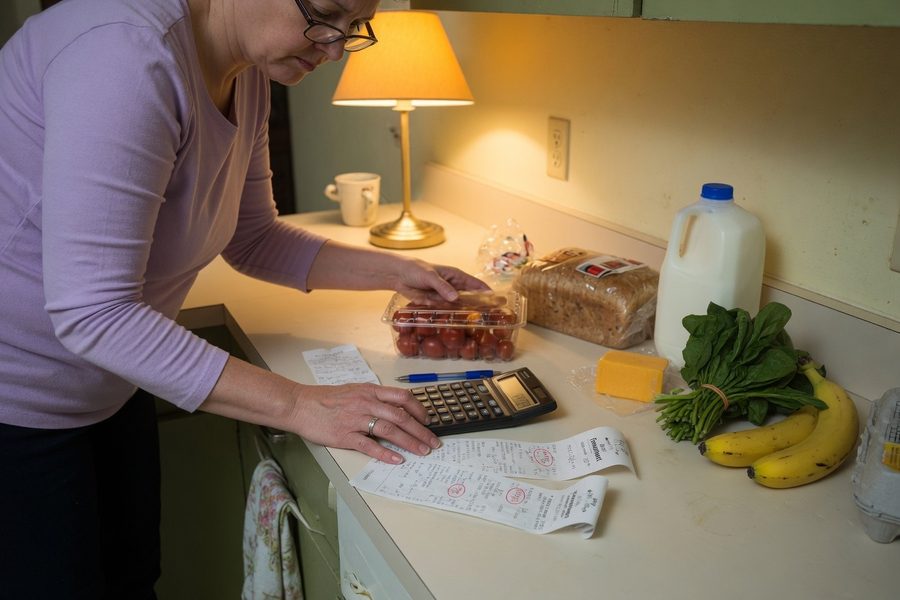
The number is not abstract. At 4.2% annual inflation, a household spending $5,000 per month on all goods and services loses roughly $210 of purchasing power every month, or $2,520 over a full year, assuming income holds flat. Run the same math on a tighter $3,500 monthly budget and the erosion is still $147 per month, or $1,764 annually. That is a car payment, two months of groceries, or a meaningful chunk of an emergency fund.
The U.S. Census Bureau’s advance estimate for May 2026 puts retail and food services sales at $763.7 billion, a large nominal number that masks the fact that a meaningful share of that “growth” is price inflation, not more goods purchased. Americans are spending more and getting less. The Bureau of Labor Statistics breaks down where the pain concentrates: energy is up 40.5% year-over-year through May 2026, shelter continues its stubborn climb, and food-at-home costs remain elevated even as the headline rate cooled briefly in late 2025.
The practical implication for budgeting is straightforward: categories with the steepest price increases require the sharpest behavioral response. Optimizing your Netflix plan while ignoring a $60-per-month gasoline increase is rearranging deck chairs. Target the big categories first.
One caveat worth naming: many of the most-cited inflation-fighting tactics, bulk buying, warehouse memberships at Costco or Sam’s Club, and pantry loading during sales, require upfront cash that households carrying high-APR credit card balances often cannot spare without adding to their debt-to-income ratio. The strategy that looks best on paper can quietly backfire if it is financed at 24% APR. That tradeoff rarely appears in advice columns, but it is real.
The K-Shaped Split: Why the Same Inflation Hits Differently
Not everyone is equally squeezed, and that gap is widening. High-income households have seen inflation-adjusted spending grow roughly 6% above their 2019 baseline, according to Numerator’s consumer panel data, while lower- and middle-income households are spending more in nominal dollars but getting less in real terms. This K-shaped divergence explains why aggregate retail sales look resilient even as consumer sentiment surveys hit multi-year lows.
The mechanics are not complicated. Higher-income households hold more equity assets, benefited disproportionately from the 2021-2022 wealth run-up, and face a smaller share of their budgets consumed by food and energy. Lower-income households spend a larger percentage of take-home pay on exactly the categories inflating fastest. A family spending 25% of income on food and energy experiences the May 2026 CPI spike very differently than a family for whom those same categories represent 10% of spending.
Credit access is another dividing line. Experian data shows that consumers with FICO Scores below 640 are being denied balance-transfer cards and personal loans at higher rates than in 2024, closing off one of the traditional safety valves during inflationary squeezes. Chase and other large card issuers have quietly tightened underwriting standards since late 2025, so the households most exposed to inflation are also finding it harder to bridge cash-flow gaps without resorting to high-cost products. The Consumer Financial Protection Bureau (CFPB) flagged this dynamic in its spring 2026 consumer credit report, noting a rise in subprime auto lending delinquencies as a leading indicator of broader household stress.
Tariffs add another layer. Broad import duties enacted in early 2026 pushed apparel, electronics, and household goods prices higher across all income segments, but budget-constrained households have fewer substitution options. If you want context on how federal assistance programs are absorbing some of this pressure, the situation around SNAP benefits amid ongoing federal budget standoffs is worth understanding, those programs are one of the few direct offsets available to lower-income households facing this exact squeeze.
Trading Down Is Now the Default, Not the Exception
Brand switching used to be a recession behavior. In 2026, it has become structural. NIQ data shows 32% of consumers are actively switching to lower-priced brands as a primary cost management strategy, and 39% report grocery spending above year-ago levels despite the switch. The two numbers coexist because private-label adoption is offsetting only part of the price increase, not eliminating it.
What is actually changing is the decision-making posture. Price is no longer one factor among several; it has become the lead filter. NIQ’s research identifies price as the top reason consumers switch products across categories, from packaged foods to personal care. Store loyalty is declining in parallel: shoppers are increasingly splitting baskets across discount grocers like Aldi and Lidl for staples, then buying specialty or fresh items elsewhere. This two-store strategy adds trip overhead but can meaningfully reduce per-unit costs on high-volume items.
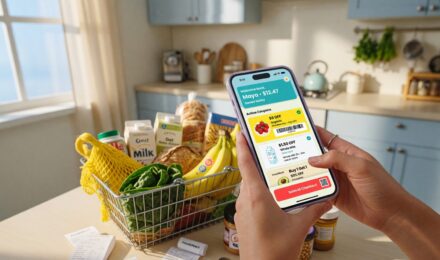
SoFi’s 2026 household spending survey found that budget-tracking app usage among users aged 25-44 has risen 28% year-over-year, with grocery and dining categories generating the most user-flagged alerts. That behavioral data aligns with what NIQ is seeing at the shelf level: consumers are not just switching brands reactively, they are actively managing category-level spend with tools their parents never used.
The U.S. Government Accountability Office’s 2025 report on product downsizing puts the shrinkflation phenomenon in sharper perspective. Shrinkflation is real and worth tracking, downsized items represented 8.6% of cereal category sales between 2021 and 2023, but the GAO’s conclusion is that it contributed less than 0.1 percentage points to the 34.5% total price increase from 2019 to 2024. The behavioral lesson: watch unit prices, not just package prices, but do not let shrinkflation anxiety distract from the larger forces at work. Coupon stacking and promotional timing are also gaining traction as default behaviors; if you want a more detailed breakdown of those tactics, this breakdown of how coupon stackers are beating inflation covers the mechanics well.
Who Should and Who Should Not
Good candidates for a full shopping-habit overhaul
These households have the most to gain from deliberately restructuring how and where they spend.
- Households whose income has grown less than 4.2% over the past 12 months and whose grocery and energy bills have both increased, the mathematical squeeze is real and compounding.
- Renters in high-shelter-cost metros who are absorbing both rent increases and elevated goods prices with no offsetting asset appreciation to cushion the gap.
- Families carrying credit card balances above $3,000 at variable rates; every dollar redirected from overspending on discretionary to debt paydown returns a guaranteed 20%+ equivalent yield. For help negotiating those rates down, negotiating your credit card APR is a concrete first move.
- Gig workers and freelancers whose income is variable and who lack employer-provided benefits, inflation hits hardest when income is unpredictable and healthcare costs rise alongside everything else. The FDIC’s 2025 survey of unbanked and underbanked households shows this group disproportionately relies on high-fee financial products that compound the strain.
- Gen Z and Millennial households in their peak spending formation years, where brand habits are not yet locked in, the behavioral flexibility exists and the long-run savings from establishing value-first habits now are substantial.
Who should skip the full overhaul
Not every household needs to rethink everything at once.
- High-income earners whose wages have outpaced inflation by more than 2 percentage points and who carry no consumer debt; marginal optimization of grocery habits returns very little relative to the time cost.
- Retirees on Social Security with a COLA adjustment that has kept pace, and low fixed expenses, their exposure to the categories inflating fastest may be lower than average.
- Households who have already switched to private-label staples, consolidated driving trips, and cut subscription overhead in the past 12 months; the easy wins are gone and further cuts may trade quality of life for marginal savings.
- Small business owners who can pass input cost increases through to pricing, their revenue naturally inflates alongside costs in a way that salaried employees’ income does not.
Frequently Asked Questions
Are inflation shopping habits in 2026 a temporary adjustment or a permanent shift?
For most households, the shift is becoming permanent. Consumers who have switched to private-label brands, consolidated grocery trips, or cut dining-out frequency for 12 or more consecutive months tend to retain those habits even after prices stabilize, the behavioral research on habit formation consistently shows that changes held for six months or longer become defaults. The structural nature of 2026’s inflation, driven by tariffs, energy, and shelter rather than one-off supply shocks, makes a near-term reversal unlikely enough that planning for permanence is the more defensible approach.
Which grocery categories offer the biggest savings from switching to store brands?
Packaged dry goods, dairy, frozen vegetables, and cleaning products typically show the smallest quality gap between national and private-label versions, and price differences of 20-40% are common. Fresh produce, artisan bread, and specialty items are where the quality difference is more meaningful; the practical approach is to switch store-brand on staples you buy every week and keep national brands only where you have tested the private-label alternative and found it genuinely inferior.
How much is the average family actually losing to inflation in 2026?
At a 4.2% CPI rate, a household spending $4,000 per month loses approximately $168 per month in purchasing power if income is flat, roughly $2,016 per year. Higher-spending households lose proportionally more in dollar terms, though the percentage hit is the same. The actual impact is worse for households concentrated in energy and food spending, since those categories are running hotter than the headline CPI figure.
Is it worth driving to a discount grocer to save money on groceries?
Only if your basket is large enough to cover the fuel and time cost. A round trip that adds 10 miles at current gasoline prices costs roughly $2-$4 in fuel alone; that math only works in your favor on weekly shops above $75-$100. For smaller, frequent trips, the discount grocer advantage often evaporates after accounting for transportation. Batch shopping once per week or every two weeks at a discount store beats multiple smaller trips to a closer, pricier alternative.
What is the single most effective change a household can make right now?
Audit your highest-frequency spending category and apply a private-label or deal-stacking strategy there first. For most households, that is groceries. A systematic switch to store-brand equivalents across 8-10 staple items can reduce a monthly grocery bill by $30-$60, which compounds to $360-$720 over a year, without cutting the volume or variety of what you buy. If you want a starting point for keeping grocery costs lower specifically, seasonal staples that keep grocery bills manageable offers a practical category-by-category look.
Sources
- U.S. Bureau of Labor Statistics, Consumer Price Index News Release, May 2026
- U.S. Census Bureau, Monthly Retail Trade: Retail and Food Services Sales
- NIQ (NielsenIQ), U.S. Consumers Redefining Value 2026
- U.S. Government Accountability Office, Product Downsizing and Consumer Prices (GAO-25-107451)
- Federal Reserve, Federal Open Market Committee: Monetary Policy Decisions
- Consumer Financial Protection Bureau (CFPB), Consumer Credit Trends
- Experian, State of Credit: Consumer Credit Review
- FDIC, National Survey of Unbanked and Underbanked Households
- U.S. Bureau of Labor Statistics, Consumer Expenditure Surveys
- Federal Reserve Bank of St. Louis (FRED), Consumer Price Index for All Urban Consumers
- Numerator, Consumer Panel Data: Spending Trends by Income Segment
- SoFi, Household Spending and Budget Tracking Survey 2026
- Social Security Administration, Cost-of-Living Adjustment (COLA) History
- Aldi U.S., Pricing and Value Overview
- Urban Institute, How Inflation Affects Low-Income Households