Fact-checked by the MyFinancial101 editorial team
Key Takeaways
- Grocery store layouts are engineered to maximize unplanned purchases: 64% of in-store shoppers make at least one impulse buy per trip, according to 2024 retail survey data.
- Shrinkflation affected less than 5% of items by count across seven household product categories from 2021 to 2023, but over three-quarters of U.S. consumers reported noticing it in the past 30 days.
- Algorithmic pricing on delivery platforms like Instacart can create price differences of up to 23% for the identical product depending on which customer is viewing it.
- Eye-level shelf placement is paid for by manufacturers, not earned by quality, store brands shelved at knee or overhead height routinely cost 20–30% less for comparable products.
- Electronic shelf labels now allow retailers to change prices multiple times per day with no notice, making it harder than ever to price-match or track genuine sale cycles.
- Tracking just one month of grocery receipts against your budget typically reveals $30–$80 in unplanned spending driven by layout, pricing psychology, and misleading promotions.
In This Guide
- Why Grocery Stores Are Designed Like a Maze
- Charm Pricing and the Power of the .99 Ending
- Deals and Promotions That Quietly Cost More
- Shrinkflation: Smaller Packages at the Same Price
- Strategic Shelf Placement and End-Cap Traps
- Digital Tools Making Prices Harder to Track
- How Discount Chains Handle These Tactics Differently
- The Disproportionate Impact on Fixed-Income Households
- How These Tricks Add Up to Real Budget Damage
Why Grocery Stores Are Designed Like a Maze
The average American household spent $475 per month on groceries in 2023, according to the Bureau of Labor Statistics, and a meaningful chunk of that total was never on anyone’s shopping list. Store layout is not an accident of architecture. It is a revenue strategy, refined over decades of consumer research, and understanding it is the first step toward resisting grocery store price tricks that operate below conscious awareness.
The most fundamental tactic is staple displacement. Milk, eggs, bread, and other high-frequency items are placed at the back corners or perimeter of the store. To reach them, shoppers must walk past an average of 30,000 to 40,000 SKUs, passing endcaps loaded with premium and impulse items along the way. Retail consultancy data consistently shows that the longer a shopper spends in-store, the higher their final receipt total. A trip that extends by just 10 minutes can add $10 to $20 in unplanned items, based on average per-minute spend benchmarks tracked in academic retail psychology studies.
Music tempo, lighting color temperature, and even aisle width are calibrated to slow foot traffic. Wider center aisles, typically 8 to 10 feet in larger supermarkets, allow shoppers to linger and browse both sides simultaneously. Softer, warmer lighting in produce sections increases perceived freshness. Slow-tempo background music, studies show, reduces average walking speed and extends dwell time by roughly 13%. None of this is coincidental. After reading this guide, you will be able to identify each of these tactics on your next trip, price-check products accurately, and build a shopping habit that protects your monthly food budget.
Unplanned Purchases: The Data Behind the Design
A 2024 retail survey found that 64% of in-store shoppers made at least one unplanned purchase during their visit. That figure has held remarkably stable for years, suggesting that store design, not individual willpower, is the primary driver. The layout creates what researchers call a “discovery environment,” where finding an item you weren’t looking for feels like a win rather than a budget leak.
Larger shopping carts amplify this effect. Retail psychology research has consistently demonstrated that cart size influences how much shoppers buy: a larger cart creates a visual cue that the cart is “not full yet,” nudging shoppers to add more items. Stores that replaced standard carts with oversized versions in controlled studies saw total spend increase by measurable double-digit percentages. When you grab a cart instead of a basket for a short trip, that decision is rarely neutral.
Supermarket floor plans are reviewed and updated regularly in partnership with retail consultants. The placement of every major category, from deli to dairy, is tested against sales-per-square-foot metrics. Your “familiar” store layout is an optimized revenue map.
Charm Pricing and the Power of the .99 Ending
Here is a counterintuitive truth about grocery pricing: $4.99 does not feel like $5.00, even though the difference is one cent. This is called left-digit bias, and it is one of the most well-documented findings in pricing psychology. The human brain anchors on the leftmost digit when processing a price, so $4.99 registers closer to $4 than to $5. Retailers have known this since at least the 1880s and deploy it systematically across every product category.
How .99 Pricing Works Against You
Across a typical 40-item grocery trip, left-digit bias can cause shoppers to systematically underestimate their total by $15 to $25. Each individual “rounding error” is small, a few cents per item, but the cumulative effect at checkout is real. Studies in the Journal of Consumer Research have shown that consumers presented with charm-priced menus or price lists recall spending less than they actually did, even immediately after the transaction.
The effect is strongest between $X.99 and the next whole dollar, but retailers also use $X.97 and $X.95 endings. The $X.95 variant is particularly common in premium or “natural” product lines, where it implies a slight quality discount without triggering the budget-brand association of a flat dollar price. Pay attention to the left digit, not the right, and you will find your mental math improves significantly.
A 2024 analysis found that algorithmic pricing on Instacart showed up to a 23% price difference for identical grocery products depending on which customer was viewing the item, a gap far larger than any .99 rounding trick.
When Rounding Up Would Actually Save You Money
A practical defense: when building a shopping list with expected costs, round every item up to the nearest dollar. A $3.99 item becomes $4. A $7.49 item becomes $8. Shoppers who do this consistently report arriving at checkout with a more accurate predicted total and, less shock-driven credit card use to cover the difference. It also makes it easier to decide in-aisle whether an item fits the trip’s budget, no calculator needed.
Deals and Promotions That Quietly Cost More
Not all promotions are designed to save you money. Some are designed to move inventory. The distinction matters, and most shoppers cannot reliably tell the difference. Consumer advocacy research indicates that roughly one in four shoppers struggle to identify genuine discounts from standard promotional tags, a finding that should make anyone pause before reaching for the red-label item.
BOGO and Multi-Buy Mechanics
Buy-one-get-one (BOGO) promotions are among the most effective tools for increasing unit sales of slow-moving or nearing-expiry stock. The psychological pull is strong: getting something “free” triggers a disproportionate sense of value. The problem is that BOGO offers frequently apply to products you would not have bought at all, or in quantities that exceed what your household will use before spoilage. Buying two of something to save on one unit is only a saving if both units get used.
Multi-buy offers, “4 for $10” or “3 for $5”, carry a related trap. In most grocery chains, you do not have to buy the stated quantity to get the per-unit price. A “4 for $10” item is usually $2.50 if you take just one. Retailers count on the fact that many shoppers do not know this and load their carts accordingly. Check the fine print on the tag or ask a store associate before grabbing extras.
Loyalty Member Pricing and the Perception of Savings
Loyalty program pricing has become one of the subtler grocery store price tricks of the past decade. Stores post two prices side by side: a higher “regular” price and a lower “member” price. The regular price is increasingly a placeholder that few customers ever pay, which means the “discount” is measured against an artificial baseline. A 2024 Federal Trade Commission report on retail pricing practices flagged this pattern specifically, noting that the reference price shown alongside a sale price is not always a price the item actually sold at in meaningful volume.
Loyalty programs also collect detailed purchase history. That data is used to calibrate personalized offers, which sounds beneficial, but it means shoppers who consistently buy a brand at full price may never receive a coupon for it, while shoppers who have shown price sensitivity get the deals. Your loyalty, may be costing you money.
Before accepting any multi-buy promotion, verify whether the per-unit price applies to a single item. In most states there is no legal requirement for the store to tell you, the burden is on the shopper to check the fine print on the shelf tag.
Shrinkflation: Smaller Packages at the Same Price
Shrinkflation is the practice of reducing product size while holding the price constant. The net result is an effective price increase that never appears as a price change on the shelf., documented examples include family-size cereal boxes reduced by 1 oz and certain ice cream containers dropping from 16 oz to 14 oz with no corresponding price cut. The packaging looks almost identical; the difference is easy to miss.
The Scale of the Problem and How to Spot It
The U.S. Government Accountability Office found that less than 5% of items across seven common household product categories were affected by shrinkflation between 2021 and 2023. That figure sounds reassuring, until you recognize that those affected items tend to be high-frequency staples like cereal, snacks, and frozen foods that households buy repeatedly. A 1-oz reduction on a box you buy twice a month compounds to 24 oz of lost product per year at the same annual cost.
Despite the relatively low percentage of items technically affected, over three-quarters of surveyed U.S. consumers noticed shrinkflation in the 30 days prior to an October 2024 survey conducted by the Purdue University Center for Food Demand Analysis and Sustainability. The gap between those two figures, less than 5% of items affected, but more than 75% of consumers noticing it, reflects the fact that shrinkflation hits the products people buy most.
Calculating the Real Per-Unit Cost Increase
The defense against shrinkflation is unit pricing: cost per ounce, per liter, or per count, not cost per package. Here is a worked example. A cereal box formerly priced at $5.49 for 18 oz works out to $0.305 per oz. After a quiet reduction to 17 oz at the same $5.49 price, the per-oz cost rises to $0.323, a 5.9% effective price increase. Over 12 monthly purchases, that amounts to roughly $0.22 extra per box, or $2.64 per year on that single item alone. Multiply across a handful of affected staples and the annual number climbs past $20 to $30 without a single sticker price ever changing.
Consumer advocacy group CHOICE advises shoppers to use unit pricing as the primary comparison tool when grocery prices are high, especially for products of different sizes. The unit price label is often present on the shelf but printed in small font, a detail that, combined with the visual similarity of reformulated packaging, allows shrinkflation to persist undetected for months.
A separate LendingTree survey found that 71% of Americans reported experiencing at least one incident of shrinkflation in the past year. The categories most commonly identified were snack foods, beverages, and paper products.
Strategic Shelf Placement and End-Cap Traps
Eye-level shelf space in a grocery store is not allocated based on product quality or consumer preference. It is sold. Manufacturers pay slotting fees, sometimes tens of thousands of dollars per SKU per region, to secure prime placement at the 4-to-5-foot height range where most adult shoppers focus naturally. The products at knee height and overhead are not inferior. They are simply from brands that did not pay for the premium real estate.
Store Brands and the Bottom-Shelf Advantage
Store-brand or private-label products consistently occupy lower and upper shelves. This is partly a cost decision (national brands pay for eye level) and partly a deliberate strategy to position the store brand as secondary. The reality is different. Many private-label products are manufactured in the same facilities as their national-brand counterparts, with minor formula variations. Store brands routinely cost 20–30% less for comparable quality. Shoppers who reflexively reach for the eye-level item without checking the shelf below are paying a premium that has nothing to do with product quality.
End-Caps and Checkout Lane Psychology
End-of-aisle displays, or end-caps, are among the most valuable retail spaces in a store. They generate 3 to 5 times more unit sales than the same product in its regular aisle position. Critically, end-caps are almost always paid placements by manufacturers. There is no guarantee the featured item is on sale, it simply looks promotional because of the display context. The visual cue of a stand-alone display activates purchase behavior even when there is no price reduction attached.
Checkout lanes are the final gauntlet. The items positioned there, candy, magazines, energy drinks, lip balm, have some of the highest margins in the store. Shoppers standing in line with full carts are psychologically primed to add small items without mentally accounting for the cost. If you want to cut grocery store price tricks off at the source, the checkout lane is worth treating as a no-buy zone by default.
Digital Tools Making Prices Harder to Track
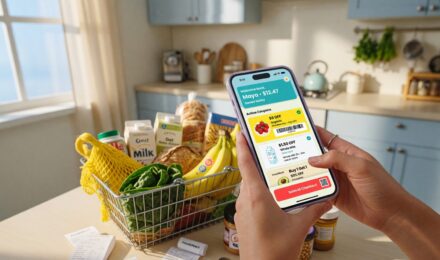
The shift to electronic shelf labels (ESLs) and algorithmic pricing has fundamentally changed the grocery pricing environment since 2024. Traditional paper tags created a practical limit on how often prices could change, reprinting and replacing them took labor and time. ESLs eliminate that constraint. A retailer can now update prices across thousands of SKUs simultaneously, multiple times per day, in response to inventory levels, competitor data feeds, or even local weather forecasts that correlate with demand patterns.
Personalized Pricing and the 23% Gap
The most significant digital pricing concern for shoppers as of early 2026 is personalized algorithmic pricing on grocery delivery platforms. Consumer Reports published a 2025 investigation finding that Instacart’s AI-driven pricing system showed price differences of up to 23% for identical products depending on which customer was viewing the item. The methodology involved using multiple test accounts with different purchase histories to order the same items from the same retailers. The variation was not explained by location, delivery fees, or promotions, it tracked with individual shopping profiles.
This matters for hybrid shoppers who price-check online before going in-store. If the price you see on an app is personalized upward based on your purchase history, your comparison shopping baseline is compromised. The practical counter is to check unit prices on the shelf itself rather than relying on app prices as a reference point.
If you use grocery delivery or pickup apps, log out and check prices in a private/incognito browser session periodically. Some platforms show different prices to logged-in users with established purchase histories versus anonymous visitors.
How Discount Chains Handle These Tactics Differently
Discount grocery chains like Aldi operate on a fundamentally different model, and the contrast is instructive. Aldi carries roughly 1,400 SKUs versus 30,000 to 40,000 at a traditional supermarket, which alone eliminates most of the shelf-placement and brand-comparison complexity that drives unplanned spending. Because Aldi primarily sells its own private-label products, there are no slotting fees, no manufacturer-paid end-caps, and no loyalty tier pricing. The price on the tag is the price for every customer.
Discount chains are not immune to all pricing psychology. Charm pricing still appears throughout Aldi’s shelves. Limited-time “ALDI Finds” displays in the center aisles are deliberately rotated weekly to create urgency and impulse purchase behavior, it is a different mechanism than a traditional end-cap, but the psychological outcome is similar. Knowing a store’s model reduces the tricks, but it does not eliminate them.
The Disproportionate Impact on Fixed-Income Households
Fixed-income and low-budget households face every tactic described in this article with less margin for error. A family buying 20 items per trip encounters the same shelf placement, charm pricing, and shrinkflation as a higher-income household buying 60 items, but the per-item cost of a bad decision represents a larger share of their total budget. Buying two of a BOGO item when one would suffice, or reaching for the eye-level brand instead of the store brand below, can represent the difference between staying within a weekly food budget and running short.
For households already managing food assistance programs like SNAP, these pricing mechanics take on additional weight. If your household is navigating federal food benefit uncertainty, our coverage of SNAP benefits at risk as federal budget standoffs continue and the rising poverty guidelines in 2026 provides relevant context on what assistance may be available. The goal of recognizing these store tactics is the same regardless of income level: keep more of your money by making deliberate choices rather than reactive ones.
Over three-quarters of U.S. consumers surveyed in October 2024 reported noticing shrinkflation at the grocery store in the previous 30 days, per Purdue University’s Center for Food Demand Analysis and Sustainability, a figure that cuts across income levels and store types.
How These Tricks Add Up to Real Budget Damage
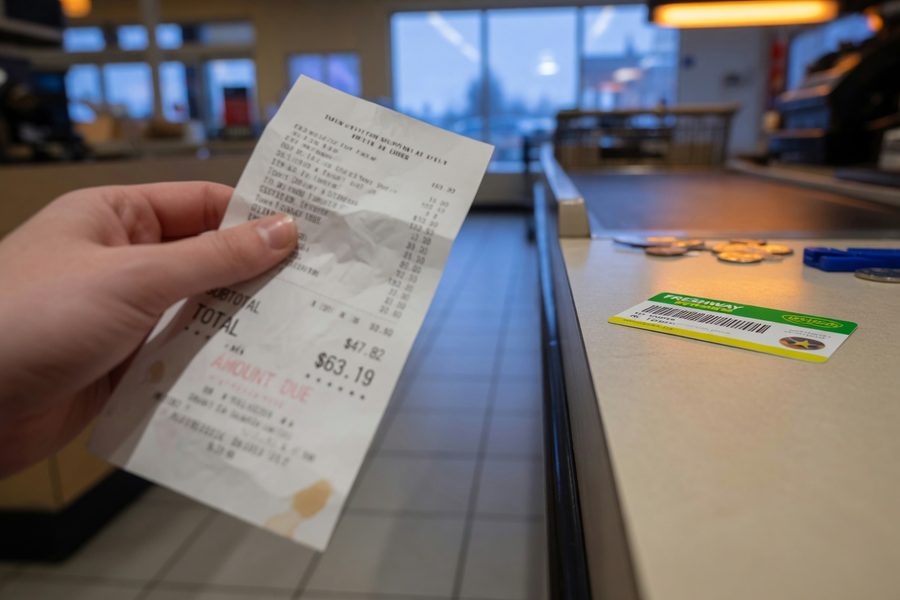
Individually, each tactic covered in this guide seems manageable. A few cents of charm pricing here, one impulse purchase there. But the compounding effect across a weekly shopping trip is where the real cost lives. Shoppers who track their receipts for a single month typically find $30 to $80 in spending that did not match their original list, driven by layout, pricing psychology, misleading promotions, and shrinkflation on regular staples.
A Monthly Receipt Audit as a Budget Tool
The most effective way to quantify your personal exposure to these tactics is a receipt audit. Keep every grocery receipt for four weeks. At the end of the month, go through each receipt and mark any item that was not on your pre-trip list. Total those amounts. That number is your “store influence spend”, and for most households it lands between 8% and 15% of total grocery spend. Knowing your number makes it concrete and measurable, which is the prerequisite for changing it.
If your grocery budget is already strained, these savings are not trivial. Recovering $50 per month from unplanned grocery spending is $600 per year. That is a meaningful addition to an emergency fund or a debt payment. For strategies on putting recovered cash to work, our guide to winter foods keeping grocery bills under control covers complementary seasonal buying tactics. And if you’re also working to offset grocery inflation through additional income, the options in jobs hiring at $19+ per hour in early 2026 are worth a look.
Unit price labels are legally required in many states, but no federal standard mandates a minimum font size or placement. A 2023 consumer behavior study found that the majority of shoppers walk past unit price labels without reading them, largely because the font is too small to read at normal walking pace.
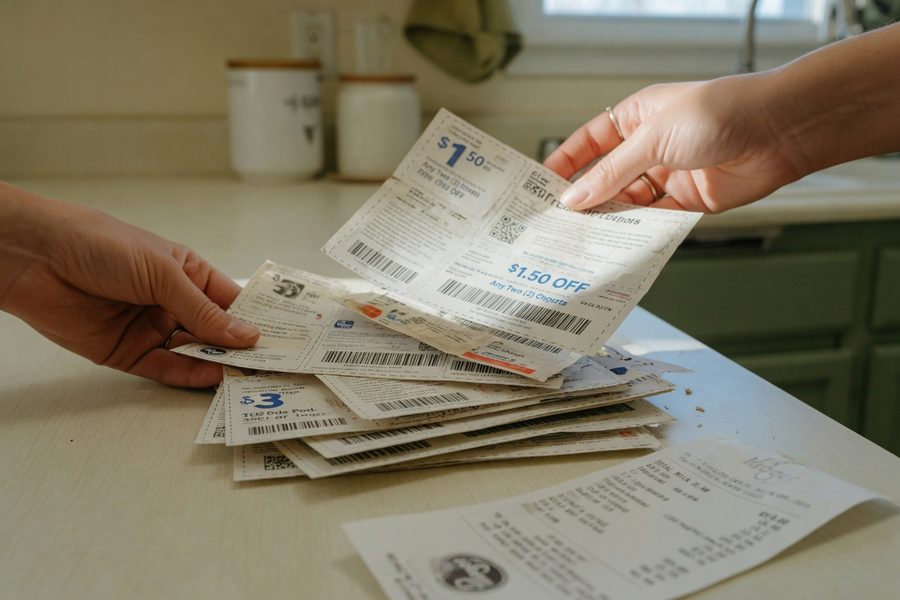
The Coupon Counter-Move
Digital coupons and stacking strategies can offset some of the pricing games described here, but only when applied deliberately. Clipping coupons for items you already buy, at prices lower than the store-brand alternative, generates genuine savings. Clipping coupons for items you would not have purchased otherwise is just a more sophisticated version of the BOGO trap. Our guide on how coupon stackers are beating inflation draws the distinction clearly and covers which categories respond best to stacking tactics in the current pricing environment.
A 2024 retail survey found 64% of in-store shoppers made at least one unplanned purchase per trip. At a conservative average of $5 per impulse item and two shopping trips per week, that is $520 in unplanned annual grocery spend for a single-person household.
Switching entirely to grocery delivery apps to avoid in-store pricing psychology may substitute one problem for another. As Consumer Reports documented in 2025, algorithmic pricing on delivery platforms can charge different customers up to 23% more for identical items based on purchase history profiles. Check unit prices on the shelf directly whenever possible.
Real-World Example: One Month of Receipts in a Two-Person Household
Consider an illustrative example: a two-person household in a mid-sized U.S. city shops at a major supermarket chain twice per week with a stated budget of $150 per week, or roughly $600 per month. Both shoppers use the store’s loyalty card, buy mostly name-brand products, and do not typically check unit prices on the shelf.
After completing a four-week receipt audit, they identify the following: $22 in BOGO items purchased in full pairs where one unit was used and one expired, $18 in end-cap purchases that were not on any list, $14 in charm-priced items where rounding up would have flagged them as over budget before reaching checkout, and approximately $11 in shrinkflation losses, products that had quietly reduced in size over the prior six months with no price change, based on a quick unit-price comparison with the store brand on the same shelf.
Total unplanned or misdirected spend: $65 for the month, representing 10.8% of their grocery budget. Over 12 months, that projects to $780 in spending driven almost entirely by store design and pricing tactics rather than deliberate choices.
In the following month, the household implements three changes: they switch to a basket for trips expected to be under 15 items, they check unit prices on every packaged product before selecting size, and they set a two-minute rule before adding any end-cap or promotional item to the cart. Their four-week total drops by $44 compared to the prior month, not to zero, but from $65 to $21 in unplanned spend. That is a 68% reduction from three behavioral changes, none of which required extreme couponing or switching stores.
Your Action Plan
-
Map your store before your next trip
Take two minutes on your next visit to note where staples like milk, eggs, and bread are located relative to the entrance. Once you know the layout, you can route directly to those sections rather than drifting through unrelated aisles. This single change reduces average dwell time and, with it, unplanned purchase exposure.
-
Switch to a basket for short trips
If your list has 12 items or fewer, take a hand basket instead of a cart. The physical limit on what you can carry acts as a natural budget enforcer. Retail research consistently shows that cart size correlates with total spend, using a basket removes that psychological nudge entirely.
-
Read unit prices, not package prices
Before selecting any packaged product, find the unit price label, cost per oz, per liter, or per count, on the shelf tag. Compare it against the store-brand alternative, which is usually on the shelf above or below. This is the primary defense against both shrinkflation and misleading multi-buy promotions. CHOICE recommends unit pricing as the most reliable comparison tool when grocery prices are volatile.
-
Audit one month of receipts
Save every grocery receipt for four weeks and total any item not on your original list. Categorize the extras: impulse buys, promotional items, BOGO extras that went unused. That total is your baseline “store influence spend.” Most households find between $30 and $80, which is the number to beat going forward.
-
Check delivery app prices in a private browser session
If you use Instacart, Shipt, or a retailer’s own app for delivery or pickup, log out and view the same items in an incognito browser window at least once a month. Personalized algorithmic pricing can mark up items by up to 23% compared to prices shown to anonymous users. If you see a significant gap, use it as a unit-price reference only, and consider buying in-store for those items instead.
-
Apply a two-minute rule to end-cap and promotional items
Before adding any item from an end-cap display, a bright promotional tag, or a checkout lane to your cart, pause for two minutes. Verify: Is this on your list? Is the unit price lower than the store-brand alternative in the aisle? Is the “discount” measured against a price the item actually sold at recently? Those three questions eliminate most impulse purchases driven by display placement and manufactured urgency.
Frequently Asked Questions
Are grocery store pricing tactics actually illegal?
Most are not. Charm pricing, strategic shelf placement, end-cap fees, and loyalty tier pricing are all legal under current U.S. retail law. What is regulated is outright deceptive pricing, for example, advertising a “sale” price that was never genuinely the regular price in any meaningful volume. The FTC has flagged misleading reference pricing practices, but enforcement is limited and complaint-driven rather than proactive. The practical implication is that most of these tactics require shopper awareness to counter, not regulatory protection.
Do I need to switch stores to avoid these tactics?
Not necessarily. The behavioral changes that matter most, checking unit prices, using a basket for small trips, auditing receipts monthly, apply regardless of which chain you shop at. Discount chains like Aldi reduce some of the complexity by carrying fewer SKUs and eliminating manufacturer-paid placements, but they still use charm pricing and impulse-oriented center-aisle displays. Changing stores without changing habits produces limited results.
How do I actually find the unit price on a shelf tag?
Unit price labels are usually printed in smaller text at the top or bottom of the standard price tag, often showing cost per ounce, per fluid ounce, or per count. Some stores use a separate smaller label adjacent to the main price tag. If you cannot find it, the store’s app often displays unit pricing in the product detail view. When in doubt, do the math yourself: divide the total price by the weight or count shown on the package.
Is shrinkflation really that significant for a household budget?
On any single item, the impact is small. A 1-oz reduction on a $5.49 cereal box represents roughly $0.22 in extra annual cost if you buy it monthly. The significance comes from the accumulation across multiple affected products and the fact that most shoppers never detect it. A household buying five commonly shrinkflated products monthly could be absorbing $15 to $30 in hidden annual price increases with no sticker price change ever appearing.
Do loyalty cards save me money or just give the store my data?
Both, with an honest caveat: the savings are real for some items, but the program is primarily designed to benefit the retailer. Loyalty programs collect detailed purchase history that retailers use to withhold coupons from brand-loyal shoppers (who do not need price incentives to buy) and target price-sensitive shoppers with deals. If you use a loyalty card, treat the member price as the baseline and evaluate it against the unit price of alternatives, not against the inflated “regular” price posted beside it.
Are online grocery prices the same as in-store prices?
Not always, and the gap has grown since 2024. Consumer Reports’ 2025 investigation found up to 23% price differences for identical items on Instacart depending on the customer’s profile. Some retailers also charge higher prices on their own apps than in-store, either as a convenience premium or through dynamic pricing. The safest approach is to verify prices against in-store shelf tags for any frequently purchased item rather than assuming digital and physical prices are aligned.
What is the fastest change I can make to reduce grocery spending this week?
Use a basket instead of a cart for any trip where your list is 15 items or fewer. This is the single change with the most immediate behavioral impact because it creates a physical constraint that overrides in-aisle decision-making. Combine it with a written list, even a notes-app list on your phone, and you will eliminate a significant portion of unplanned purchases on the first trip.
How do I handle a BOGO deal without overspending?
Before adding the second item to your cart, answer two questions: Will your household use both units before the expiration date? Is the total cost of two units still less than buying the store-brand version of just one? If both answers are yes, the deal is genuine. If either answer is no, buying one at full price, or the store brand at its regular price, is the better financial outcome. BOGO deals on non-perishables with long shelf lives are usually worthwhile; BOGO on fresh or refrigerated items require more scrutiny.
Are there tools or apps that help track grocery prices over time?
Several apps track historical price data for grocery items, including Flipp, which aggregates weekly circulars and shows price trends, and store-specific apps that sometimes display price history in the product detail view. For a low-tech alternative, keeping a simple price book, a list of your 20 most-purchased items with their regular and sale unit prices, takes about 15 minutes to build and immediately reveals when a “sale” is below your tracked baseline versus just a promotional display. If you want to extend your savings beyond the grocery store, our guide on how coupon stackers are beating inflation covers digital stacking tools that work in combination with price tracking.
Sources
- U.S. Bureau of Labor Statistics, Consumer Expenditure Surveys: Annual Tables
- U.S. Government Accountability Office, What Is Shrinkflation and How Has It Affected Grocery Store Items Recently?
- Purdue University Center for Food Demand Analysis and Sustainability, Most Surveyed Grocery Shoppers Report Noticing Shrinkflation
- LendingTree, Shrinkflation Report: 71% of Americans Report Experiencing Shrinkflation
- Consumer Reports, Instacart AI Pricing Experiment Inflating Grocery Bills
- CHOICE, Unit Pricing Survey: Rising Grocery Prices
- National Institutes of Health / PubMed Central, Retail Environment and Consumer Behavior Research
- MyFinancial101, The Winter Foods Keeping Grocery Bills Under Control
- MyFinancial101, How Coupon Stackers Are Beating Inflation